- South Korea
- /
- Electronic Equipment and Components
- /
- KOSDAQ:A042600
Seronics Co., Ltd.'s (KOSDAQ:042600) 26% Price Boost Is Out Of Tune With Revenues

Seronics Co., Ltd. (KOSDAQ:042600) shareholders are no doubt pleased to see that the share price has bounced 26% in the last month, although it is still struggling to make up recently lost ground. Unfortunately, the gains of the last month did little to right the losses of the last year with the stock still down 41% over that time.
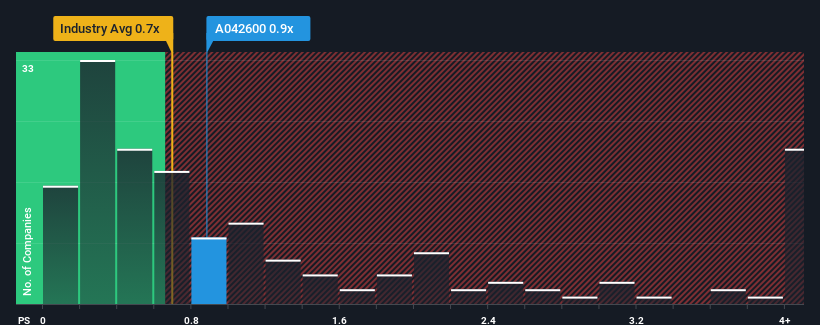
In spite of the firm bounce in price, it's still not a stretch to say that Seronics' price-to-sales (or "P/S") ratio of 0.9x right now seems quite "middle-of-the-road" compared to the Electronic industry in Korea, where the median P/S ratio is around 0.7x. While this might not raise any eyebrows, if the P/S ratio is not justified investors could be missing out on a potential opportunity or ignoring looming disappointment.
See our latest analysis for Seronics
How Has Seronics Performed Recently?
It looks like revenue growth has deserted Seronics recently, which is not something to boast about. It might be that many expect the uninspiring revenue performance to only match most other companies at best over the coming period, which has kept the P/S from rising. Those who are bullish on Seronics will be hoping that this isn't the case, so that they can pick up the stock at a lower valuation.
We don't have analyst forecasts, but you can see how recent trends are setting up the company for the future by checking out our free report on Seronics' earnings, revenue and cash flow.What Are Revenue Growth Metrics Telling Us About The P/S?
There's an inherent assumption that a company should be matching the industry for P/S ratios like Seronics' to be considered reasonable.
Taking a look back first, we see that there was hardly any revenue growth to speak of for the company over the past year. Regardless, revenue has managed to lift by a handy 12% in aggregate from three years ago, thanks to the earlier period of growth. Therefore, it's fair to say that revenue growth has been inconsistent recently for the company.
Comparing the recent medium-term revenue trends against the industry's one-year growth forecast of 12% shows it's noticeably less attractive.
In light of this, it's curious that Seronics' P/S sits in line with the majority of other companies. It seems most investors are ignoring the fairly limited recent growth rates and are willing to pay up for exposure to the stock. They may be setting themselves up for future disappointment if the P/S falls to levels more in line with recent growth rates.
The Bottom Line On Seronics' P/S
Its shares have lifted substantially and now Seronics' P/S is back within range of the industry median. It's argued the price-to-sales ratio is an inferior measure of value within certain industries, but it can be a powerful business sentiment indicator.
Our examination of Seronics revealed its poor three-year revenue trends aren't resulting in a lower P/S as per our expectations, given they look worse than current industry outlook. Right now we are uncomfortable with the P/S as this revenue performance isn't likely to support a more positive sentiment for long. If recent medium-term revenue trends continue, the probability of a share price decline will become quite substantial, placing shareholders at risk.
It's always necessary to consider the ever-present spectre of investment risk. We've identified 1 warning sign with Seronics, and understanding should be part of your investment process.
If you're unsure about the strength of Seronics' business, why not explore our interactive list of stocks with solid business fundamentals for some other companies you may have missed.
The New Payments ETF Is Live on NASDAQ:
Money is moving to real-time rails, and a newly listed ETF now gives investors direct exposure. Fast settlement. Institutional custody. Simple access.
Explore how this launch could reshape portfolios
Sponsored ContentNew: Manage All Your Stock Portfolios in One Place
We've created the ultimate portfolio companion for stock investors, and it's free.
• Connect an unlimited number of Portfolios and see your total in one currency
• Be alerted to new Warning Signs or Risks via email or mobile
• Track the Fair Value of your stocks
Have feedback on this article? Concerned about the content? Get in touch with us directly. Alternatively, email editorial-team (at) simplywallst.com.
This article by Simply Wall St is general in nature. We provide commentary based on historical data and analyst forecasts only using an unbiased methodology and our articles are not intended to be financial advice. It does not constitute a recommendation to buy or sell any stock, and does not take account of your objectives, or your financial situation. We aim to bring you long-term focused analysis driven by fundamental data. Note that our analysis may not factor in the latest price-sensitive company announcements or qualitative material. Simply Wall St has no position in any stocks mentioned.
About KOSDAQ:A042600
Seronics
Manufactures and sells electronic components in Korea and North America.
Low risk with worrying balance sheet.
Market Insights

Weekly Picks

THE KINGDOM OF BROWN GOODS: WHY MGPI IS BEING CRUSHED BY INVENTORY & PRIMED FOR RESURRECTION


Why Vertical Aerospace (NYSE: EVTL) is Worth Possibly Over 13x its Current Price


The Quiet Giant That Became AI’s Power Grid
Recently Updated Narratives


A case for USD $14.81 per share based on book value. Be warned, this is a micro-cap dependent on a single mine.

Occidental Petroleum to Become Fairly Priced at $68.29 According to Future Projections

Agfa-Gevaert is a digital and materials turnaround opportunity, with growth potential in ZIRFON, but carrying legacy risks.
Popular Narratives


MicroVision will explode future revenue by 380.37% with a vision towards success


Crazy Undervalued 42 Baggers Silver Play (Active & Running Mine)


