- South Korea
- /
- Software
- /
- KOSDAQ:A205100
Does EXEM's (KOSDAQ:205100) Share Price Gain of 39% Match Its Business Performance?

Diversification is a key tool for dealing with stock price volatility. But if you're going to beat the market overall, you need to have individual stocks that outperform. EXEM Co., Ltd. (KOSDAQ:205100) has done well over the last year, with the stock price up 39% beating the market return of 34% (not including dividends). On the other hand, longer term shareholders have had a tougher run, with the stock falling 5.9% in three years.
Check out our latest analysis for EXEM
To quote Buffett, 'Ships will sail around the world but the Flat Earth Society will flourish. There will continue to be wide discrepancies between price and value in the marketplace...' One way to examine how market sentiment has changed over time is to look at the interaction between a company's share price and its earnings per share (EPS).
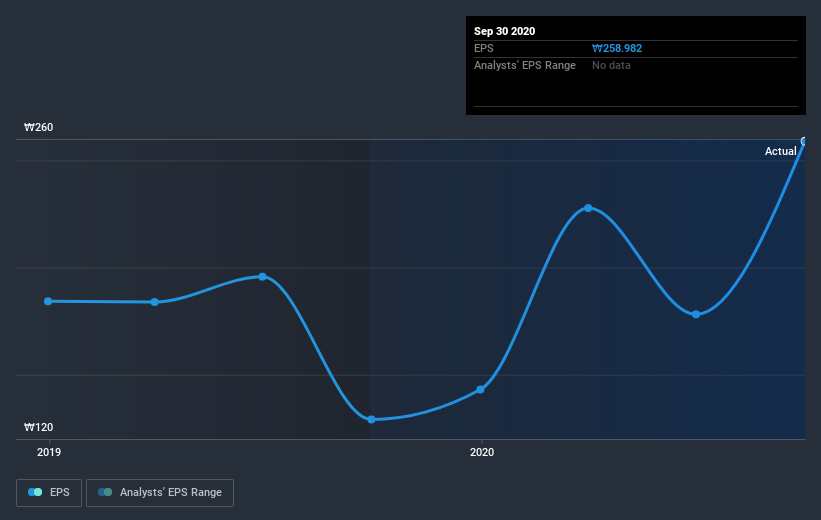
EXEM was able to grow EPS by 100% in the last twelve months. This EPS growth is significantly higher than the 39% increase in the share price. Therefore, it seems the market isn't as excited about EXEM as it was before. This could be an opportunity.
The image below shows how EPS has tracked over time (if you click on the image you can see greater detail).
Dive deeper into EXEM's key metrics by checking this interactive graph of EXEM's earnings, revenue and cash flow.
A Different Perspective
EXEM shareholders have received returns of 39% over twelve months, which isn't far from the general market return. To take a positive view, the gain is pleasing, and it sure beats annualized TSR loss of 2%, which was endured over half a decade. While 'turnarounds seldom turn' there are green shoots for EXEM. It's always interesting to track share price performance over the longer term. But to understand EXEM better, we need to consider many other factors. For example, we've discovered 1 warning sign for EXEM that you should be aware of before investing here.
Of course EXEM may not be the best stock to buy. So you may wish to see this free collection of growth stocks.
Please note, the market returns quoted in this article reflect the market weighted average returns of stocks that currently trade on KR exchanges.
If you’re looking to trade EXEM, open an account with the lowest-cost* platform trusted by professionals, Interactive Brokers. Their clients from over 200 countries and territories trade stocks, options, futures, forex, bonds and funds worldwide from a single integrated account. Promoted
The New Payments ETF Is Live on NASDAQ:
Money is moving to real-time rails, and a newly listed ETF now gives investors direct exposure. Fast settlement. Institutional custody. Simple access.
Explore how this launch could reshape portfolios
Sponsored ContentValuation is complex, but we're here to simplify it.
Discover if EXEM might be undervalued or overvalued with our detailed analysis, featuring fair value estimates, potential risks, dividends, insider trades, and its financial condition.
Access Free AnalysisThis article by Simply Wall St is general in nature. It does not constitute a recommendation to buy or sell any stock, and does not take account of your objectives, or your financial situation. We aim to bring you long-term focused analysis driven by fundamental data. Note that our analysis may not factor in the latest price-sensitive company announcements or qualitative material. Simply Wall St has no position in any stocks mentioned.
*Interactive Brokers Rated Lowest Cost Broker by StockBrokers.com Annual Online Review 2020
Have feedback on this article? Concerned about the content? Get in touch with us directly. Alternatively, email editorial-team@simplywallst.com.
About KOSDAQ:A205100
EXEM
Operates as an IT performance management and big data platform company Korea and internationally.
Excellent balance sheet with proven track record.
Market Insights

Weekly Picks

Early mover in a fast growing industry. Likely to experience share price volatility as they scale


A case for CA$31.80 (undiluted), aka 8,616% upside from CA$0.37 (an 86 bagger!).


Moderation and Stabilisation: HOLD: Fair Price based on a 4-year Cycle is $12.08
Recently Updated Narratives

Airbnb Stock: Platform Growth in a World of Saturation and Scrutiny

Adobe Stock: AI-Fueled ARR Growth Pushes Guidance Higher, But Cost Pressures Loom

Thomson Reuters Stock: When Legal Intelligence Becomes Mission-Critical Infrastructure
Popular Narratives


Crazy Undervalued 42 Baggers Silver Play (Active & Running Mine)


NVDA: Expanding AI Demand Will Drive Major Data Center Investments Through 2026

The AI Infrastructure Giant Grows Into Its Valuation
Trending Discussion


