- South Korea
- /
- Software
- /
- KOSDAQ:A053800
Should Weakness in AhnLab, Inc.'s (KOSDAQ:053800) Stock Be Seen As A Sign That Market Will Correct The Share Price Given Decent Financials?

It is hard to get excited after looking at AhnLab's (KOSDAQ:053800) recent performance, when its stock has declined 16% over the past month. But if you pay close attention, you might find that its key financial indicators look quite decent, which could mean that the stock could potentially rise in the long-term given how markets usually reward more resilient long-term fundamentals. Particularly, we will be paying attention to AhnLab's ROE today.
Return on equity or ROE is a key measure used to assess how efficiently a company's management is utilizing the company's capital. Simply put, it is used to assess the profitability of a company in relation to its equity capital.
How Is ROE Calculated?
Return on equity can be calculated by using the formula:
Return on Equity = Net Profit (from continuing operations) ÷ Shareholders' Equity
So, based on the above formula, the ROE for AhnLab is:
8.8% = ₩32b ÷ ₩369b (Based on the trailing twelve months to December 2024).
The 'return' is the profit over the last twelve months. One way to conceptualize this is that for each ₩1 of shareholders' capital it has, the company made ₩0.09 in profit.
View our latest analysis for AhnLab
What Is The Relationship Between ROE And Earnings Growth?
So far, we've learned that ROE is a measure of a company's profitability. Based on how much of its profits the company chooses to reinvest or "retain", we are then able to evaluate a company's future ability to generate profits. Generally speaking, other things being equal, firms with a high return on equity and profit retention, have a higher growth rate than firms that don’t share these attributes.
A Side By Side comparison of AhnLab's Earnings Growth And 8.8% ROE
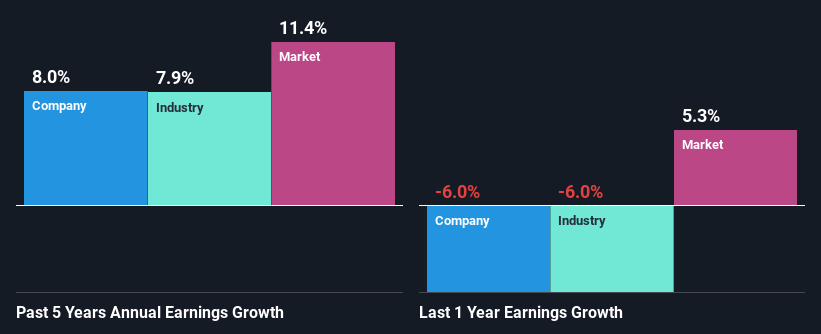
When you first look at it, AhnLab's ROE doesn't look that attractive. Yet, a closer study shows that the company's ROE is similar to the industry average of 7.3%. On the other hand, AhnLab reported a moderate 8.0% net income growth over the past five years. Taking into consideration that the ROE is not particularly high, we reckon that there could also be other factors at play which could be influencing the company's growth. For instance, the company has a low payout ratio or is being managed efficiently.
We then performed a comparison between AhnLab's net income growth with the industry, which revealed that the company's growth is similar to the average industry growth of 7.9% in the same 5-year period.
Earnings growth is a huge factor in stock valuation. The investor should try to establish if the expected growth or decline in earnings, whichever the case may be, is priced in. By doing so, they will have an idea if the stock is headed into clear blue waters or if swampy waters await. Is AhnLab fairly valued compared to other companies? These 3 valuation measures might help you decide.
Is AhnLab Using Its Retained Earnings Effectively?
AhnLab has a healthy combination of a moderate three-year median payout ratio of 37% (or a retention ratio of 63%) and a respectable amount of growth in earnings as we saw above, meaning that the company has been making efficient use of its profits.
Besides, AhnLab has been paying dividends over a period of five years. This shows that the company is committed to sharing profits with its shareholders.
Conclusion
In total, it does look like AhnLab has some positive aspects to its business. Despite its low rate of return, the fact that the company reinvests a very high portion of its profits into its business, no doubt contributed to its high earnings growth. While we won't completely dismiss the company, what we would do, is try to ascertain how risky the business is to make a more informed decision around the company. Our risks dashboard will have the 1 risk we have identified for AhnLab.
The New Payments ETF Is Live on NASDAQ:
Money is moving to real-time rails, and a newly listed ETF now gives investors direct exposure. Fast settlement. Institutional custody. Simple access.
Explore how this launch could reshape portfolios
Sponsored ContentNew: Manage All Your Stock Portfolios in One Place
We've created the ultimate portfolio companion for stock investors, and it's free.
• Connect an unlimited number of Portfolios and see your total in one currency
• Be alerted to new Warning Signs or Risks via email or mobile
• Track the Fair Value of your stocks
Have feedback on this article? Concerned about the content? Get in touch with us directly. Alternatively, email editorial-team (at) simplywallst.com.
This article by Simply Wall St is general in nature. We provide commentary based on historical data and analyst forecasts only using an unbiased methodology and our articles are not intended to be financial advice. It does not constitute a recommendation to buy or sell any stock, and does not take account of your objectives, or your financial situation. We aim to bring you long-term focused analysis driven by fundamental data. Note that our analysis may not factor in the latest price-sensitive company announcements or qualitative material. Simply Wall St has no position in any stocks mentioned.
About KOSDAQ:A053800
AhnLab
Provides information security solutions and services for consumers, enterprises, and small and medium businesses worldwide.
Flawless balance sheet and good value.
Market Insights

Weekly Picks

Early mover in a fast growing industry. Likely to experience share price volatility as they scale


A case for CA$31.80 (undiluted), aka 8,616% upside from CA$0.37 (an 86 bagger!).


Moderation and Stabilisation: HOLD: Fair Price based on a 4-year Cycle is $12.08
Recently Updated Narratives

Airbnb Stock: Platform Growth in a World of Saturation and Scrutiny

Adobe Stock: AI-Fueled ARR Growth Pushes Guidance Higher, But Cost Pressures Loom

Thomson Reuters Stock: When Legal Intelligence Becomes Mission-Critical Infrastructure
Popular Narratives


Crazy Undervalued 42 Baggers Silver Play (Active & Running Mine)


NVDA: Expanding AI Demand Will Drive Major Data Center Investments Through 2026

The AI Infrastructure Giant Grows Into Its Valuation
Trending Discussion


