
Advertisement
Howard Marks put it nicely when he said that, rather than worrying about share price volatility, 'The possibility of permanent loss is the risk I worry about... and every practical investor I know worries about.' When we think about how risky a company is, we always like to look at its use of debt, since debt overload can lead to ruin. Importantly, SK hynix Inc. (KRX:000660) does carry debt. But should shareholders be worried about its use of debt?
When Is Debt A Problem?
Debt assists a business until the business has trouble paying it off, either with new capital or with free cash flow. If things get really bad, the lenders can take control of the business. While that is not too common, we often do see indebted companies permanently diluting shareholders because lenders force them to raise capital at a distressed price. Having said that, the most common situation is where a company manages its debt reasonably well - and to its own advantage. When we think about a company's use of debt, we first look at cash and debt together.
View our latest analysis for SK hynix
What Is SK hynix's Debt?
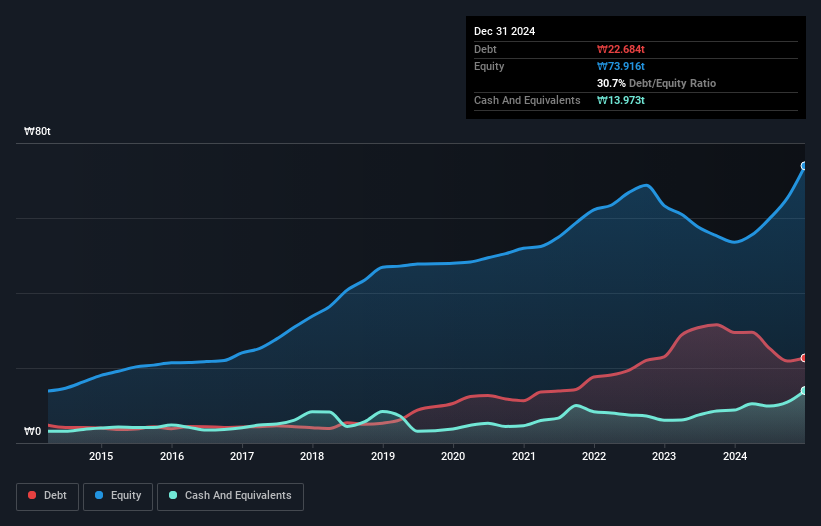
The image below, which you can click on for greater detail, shows that SK hynix had debt of ₩23t at the end of December 2024, a reduction from ₩29t over a year. However, because it has a cash reserve of ₩14t, its net debt is less, at about ₩8.71t.
How Strong Is SK hynix's Balance Sheet?
According to the last reported balance sheet, SK hynix had liabilities of ₩25t due within 12 months, and liabilities of ₩21t due beyond 12 months. Offsetting this, it had ₩14t in cash and ₩14t in receivables that were due within 12 months. So its liabilities total ₩18t more than the combination of its cash and short-term receivables.
Since publicly traded SK hynix shares are worth a very impressive total of ₩137t, it seems unlikely that this level of liabilities would be a major threat. Having said that, it's clear that we should continue to monitor its balance sheet, lest it change for the worse.
In order to size up a company's debt relative to its earnings, we calculate its net debt divided by its earnings before interest, tax, depreciation, and amortization (EBITDA) and its earnings before interest and tax (EBIT) divided by its interest expense (its interest cover). Thus we consider debt relative to earnings both with and without depreciation and amortization expenses.
SK hynix's net debt is only 0.25 times its EBITDA. And its EBIT covers its interest expense a whopping 24.2 times over. So we're pretty relaxed about its super-conservative use of debt. Although SK hynix made a loss at the EBIT level, last year, it was also good to see that it generated ₩23t in EBIT over the last twelve months. There's no doubt that we learn most about debt from the balance sheet. But it is future earnings, more than anything, that will determine SK hynix's ability to maintain a healthy balance sheet going forward. So if you want to see what the professionals think, you might find this free report on analyst profit forecasts to be interesting.
Finally, a business needs free cash flow to pay off debt; accounting profits just don't cut it. So it's worth checking how much of the earnings before interest and tax (EBIT) is backed by free cash flow. Over the most recent year, SK hynix recorded free cash flow worth 56% of its EBIT, which is around normal, given free cash flow excludes interest and tax. This cold hard cash means it can reduce its debt when it wants to.
Our View
SK hynix's interest cover suggests it can handle its debt as easily as Cristiano Ronaldo could score a goal against an under 14's goalkeeper. And that's just the beginning of the good news since its net debt to EBITDA is also very heartening. When we consider the range of factors above, it looks like SK hynix is pretty sensible with its use of debt. While that brings some risk, it can also enhance returns for shareholders. Over time, share prices tend to follow earnings per share, so if you're interested in SK hynix, you may well want to click here to check an interactive graph of its earnings per share history.
At the end of the day, it's often better to focus on companies that are free from net debt. You can access our special list of such companies (all with a track record of profit growth). It's free.
New: Manage All Your Stock Portfolios in One Place
We've created the ultimate portfolio companion for stock investors, and it's free.
• Connect an unlimited number of Portfolios and see your total in one currency
• Be alerted to new Warning Signs or Risks via email or mobile
• Track the Fair Value of your stocks
Have feedback on this article? Concerned about the content? Get in touch with us directly. Alternatively, email editorial-team (at) simplywallst.com.
This article by Simply Wall St is general in nature. We provide commentary based on historical data and analyst forecasts only using an unbiased methodology and our articles are not intended to be financial advice. It does not constitute a recommendation to buy or sell any stock, and does not take account of your objectives, or your financial situation. We aim to bring you long-term focused analysis driven by fundamental data. Note that our analysis may not factor in the latest price-sensitive company announcements or qualitative material. Simply Wall St has no position in any stocks mentioned.
About KOSE:A000660
SK hynix
Manufactures, distributes, and sells semiconductor products in Korea, China, rest of Asia, the United States, and Europe.
Outstanding track record and undervalued.
Similar Companies
Market Insights

Advertisement
Community Narratives
MicroVision will explode future revenue by 380.37% with a vision towards success
Fair Value US$60.00|98.4% undervalued
TH
Community Contributor
The Indispensable Artery for a New North American Economy
Fair Value CA$132.87|1.3% undervalued
TI
Community Contributor