- South Korea
- /
- Semiconductors
- /
- KOSDAQ:A440110
FADU Inc.'s (KOSDAQ:440110) Share Price Is Still Matching Investor Opinion Despite 28% Slump
Unfortunately for some shareholders, the FADU Inc. (KOSDAQ:440110) share price has dived 28% in the last thirty days, prolonging recent pain. The drop over the last 30 days has capped off a tough year for shareholders, with the share price down 44% in that time.
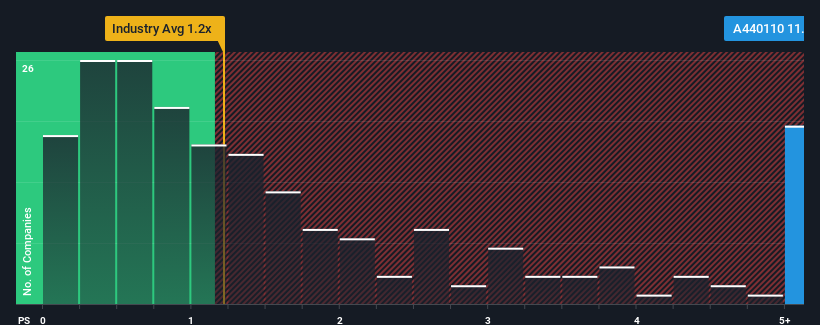
Although its price has dipped substantially, given around half the companies in Korea's Semiconductor industry have price-to-sales ratios (or "P/S") below 1.2x, you may still consider FADU as a stock to avoid entirely with its 11.7x P/S ratio. Although, it's not wise to just take the P/S at face value as there may be an explanation why it's so lofty.
Check out our latest analysis for FADU

What Does FADU's Recent Performance Look Like?
Recent revenue growth for FADU has been in line with the industry. One possibility is that the P/S ratio is high because investors think this modest revenue performance will accelerate. However, if this isn't the case, investors might get caught out paying too much for the stock.
Want the full picture on analyst estimates for the company? Then our free report on FADU will help you uncover what's on the horizon.Is There Enough Revenue Growth Forecasted For FADU?
There's an inherent assumption that a company should far outperform the industry for P/S ratios like FADU's to be considered reasonable.
If we review the last year of revenue growth, the company posted a terrific increase of 94%. This great performance means it was also able to deliver immense revenue growth over the last three years. So we can start by confirming that the company has done a tremendous job of growing revenue over that time.
Turning to the outlook, the next year should generate growth of 207% as estimated by the only analyst watching the company. That's shaping up to be materially higher than the 29% growth forecast for the broader industry.
With this in mind, it's not hard to understand why FADU's P/S is high relative to its industry peers. Apparently shareholders aren't keen to offload something that is potentially eyeing a more prosperous future.
The Key Takeaway
Even after such a strong price drop, FADU's P/S still exceeds the industry median significantly. It's argued the price-to-sales ratio is an inferior measure of value within certain industries, but it can be a powerful business sentiment indicator.
We've established that FADU maintains its high P/S on the strength of its forecasted revenue growth being higher than the the rest of the Semiconductor industry, as expected. At this stage investors feel the potential for a deterioration in revenues is quite remote, justifying the elevated P/S ratio. Unless these conditions change, they will continue to provide strong support to the share price.
And what about other risks? Every company has them, and we've spotted 1 warning sign for FADU you should know about.
If companies with solid past earnings growth is up your alley, you may wish to see this free collection of other companies with strong earnings growth and low P/E ratios.
New: AI Stock Screener & Alerts
Our new AI Stock Screener scans the market every day to uncover opportunities.
• Dividend Powerhouses (3%+ Yield)
• Undervalued Small Caps with Insider Buying
• High growth Tech and AI Companies
Or build your own from over 50 metrics.
Have feedback on this article? Concerned about the content? Get in touch with us directly. Alternatively, email editorial-team (at) simplywallst.com.
This article by Simply Wall St is general in nature. We provide commentary based on historical data and analyst forecasts only using an unbiased methodology and our articles are not intended to be financial advice. It does not constitute a recommendation to buy or sell any stock, and does not take account of your objectives, or your financial situation. We aim to bring you long-term focused analysis driven by fundamental data. Note that our analysis may not factor in the latest price-sensitive company announcements or qualitative material. Simply Wall St has no position in any stocks mentioned.
About KOSDAQ:A440110
FADU
A fabless semiconductor company, develops and manufactures flash controller architecture for solid-state drives (SSD).
Mediocre balance sheet with limited growth.
Market Insights
Community Narratives


Recently Updated Narratives


MINISO's fair value is projected at 26.69 with an anticipated PE ratio shift of 20x


The Quiet Giant That Became AI’s Power Grid


Nova Ljubljanska Banka d.d will expect a 11.2% revenue boost driving future growth
Popular Narratives


The company that turned a verb into a global necessity and basically runs the modern internet, digital ads, smartphones, maps, and AI.


MicroVision will explode future revenue by 380.37% with a vision towards success


