
Advertisement
- South Korea
- /
- Semiconductors
- /
- KOSDAQ:A327260
Does RF Materials (KOSDAQ:327260) Have A Healthy Balance Sheet?
Some say volatility, rather than debt, is the best way to think about risk as an investor, but Warren Buffett famously said that 'Volatility is far from synonymous with risk.' It's only natural to consider a company's balance sheet when you examine how risky it is, since debt is often involved when a business collapses. Importantly, RF Materials Co., Ltd. (KOSDAQ:327260) does carry debt. But should shareholders be worried about its use of debt?
When Is Debt Dangerous?
Debt and other liabilities become risky for a business when it cannot easily fulfill those obligations, either with free cash flow or by raising capital at an attractive price. In the worst case scenario, a company can go bankrupt if it cannot pay its creditors. While that is not too common, we often do see indebted companies permanently diluting shareholders because lenders force them to raise capital at a distressed price. Having said that, the most common situation is where a company manages its debt reasonably well - and to its own advantage. The first step when considering a company's debt levels is to consider its cash and debt together.
Check out our latest analysis for RF Materials
How Much Debt Does RF Materials Carry?
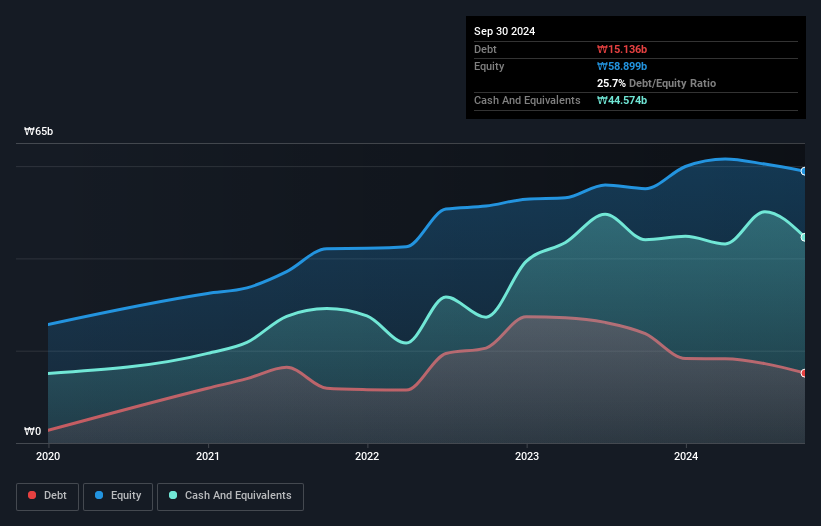
The image below, which you can click on for greater detail, shows that RF Materials had debt of ₩15.1b at the end of September 2024, a reduction from ₩23.7b over a year. But on the other hand it also has ₩44.6b in cash, leading to a ₩29.4b net cash position.
How Healthy Is RF Materials' Balance Sheet?
According to the last reported balance sheet, RF Materials had liabilities of ₩33.5b due within 12 months, and liabilities of ₩3.91b due beyond 12 months. Offsetting these obligations, it had cash of ₩44.6b as well as receivables valued at ₩5.78b due within 12 months. So it can boast ₩12.9b more liquid assets than total liabilities.
It's good to see that RF Materials has plenty of liquidity on its balance sheet, suggesting conservative management of liabilities. Due to its strong net asset position, it is not likely to face issues with its lenders. Succinctly put, RF Materials boasts net cash, so it's fair to say it does not have a heavy debt load! When analysing debt levels, the balance sheet is the obvious place to start. But you can't view debt in total isolation; since RF Materials will need earnings to service that debt. So when considering debt, it's definitely worth looking at the earnings trend. Click here for an interactive snapshot.
Over 12 months, RF Materials made a loss at the EBIT level, and saw its revenue drop to ₩43b, which is a fall of 14%. That's not what we would hope to see.
So How Risky Is RF Materials?
Although RF Materials had an earnings before interest and tax (EBIT) loss over the last twelve months, it generated positive free cash flow of ₩4.7b. So taking that on face value, and considering the net cash situation, we don't think that the stock is too risky in the near term. With mediocre revenue growth in the last year, we're don't find the investment opportunity particularly compelling. When analysing debt levels, the balance sheet is the obvious place to start. But ultimately, every company can contain risks that exist outside of the balance sheet. For example RF Materials has 2 warning signs (and 1 which is a bit unpleasant) we think you should know about.
If, after all that, you're more interested in a fast growing company with a rock-solid balance sheet, then check out our list of net cash growth stocks without delay.
New: AI Stock Screener & Alerts
Our new AI Stock Screener scans the market every day to uncover opportunities.
• Dividend Powerhouses (3%+ Yield)
• Undervalued Small Caps with Insider Buying
• High growth Tech and AI Companies
Or build your own from over 50 metrics.
Have feedback on this article? Concerned about the content? Get in touch with us directly. Alternatively, email editorial-team (at) simplywallst.com.
This article by Simply Wall St is general in nature. We provide commentary based on historical data and analyst forecasts only using an unbiased methodology and our articles are not intended to be financial advice. It does not constitute a recommendation to buy or sell any stock, and does not take account of your objectives, or your financial situation. We aim to bring you long-term focused analysis driven by fundamental data. Note that our analysis may not factor in the latest price-sensitive company announcements or qualitative material. Simply Wall St has no position in any stocks mentioned.
About KOSDAQ:A327260
RF Materials
Develops, produces, and sells optical communication packages in Korea and internationally.
Flawless balance sheet with low risk.
Similar Companies
Market Insights

Advertisement
Community Narratives
MicroVision will explode future revenue by 380.37% with a vision towards success
Fair Value US$60.00|98.4% undervalued
TH
Community Contributor
The Indispensable Artery for a New North American Economy
Fair Value CA$132.87|1.3% undervalued
TI
Community Contributor