
Advertisement
- South Korea
- /
- Semiconductors
- /
- KOSDAQ:A317330
There's Reason For Concern Over DUKSAN TECHOPIA Co.,Ltd.'s (KOSDAQ:317330) Massive 52% Price Jump
Despite an already strong run, DUKSAN TECHOPIA Co.,Ltd. (KOSDAQ:317330) shares have been powering on, with a gain of 52% in the last thirty days. Looking back a bit further, it's encouraging to see the stock is up 87% in the last year.
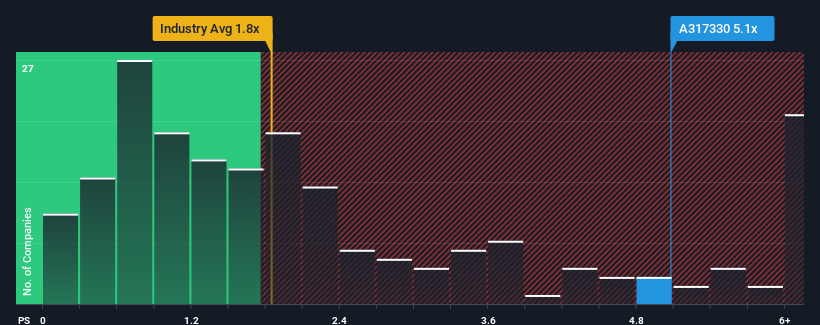
Since its price has surged higher, when almost half of the companies in Korea's Semiconductor industry have price-to-sales ratios (or "P/S") below 1.8x, you may consider DUKSAN TECHOPIALtd as a stock not worth researching with its 5.1x P/S ratio. Nonetheless, we'd need to dig a little deeper to determine if there is a rational basis for the highly elevated P/S.
Check out our latest analysis for DUKSAN TECHOPIALtd
What Does DUKSAN TECHOPIALtd's Recent Performance Look Like?
As an illustration, revenue has deteriorated at DUKSAN TECHOPIALtd over the last year, which is not ideal at all. Perhaps the market believes the company can do enough to outperform the rest of the industry in the near future, which is keeping the P/S ratio high. You'd really hope so, otherwise you're paying a pretty hefty price for no particular reason.
Want the full picture on earnings, revenue and cash flow for the company? Then our free report on DUKSAN TECHOPIALtd will help you shine a light on its historical performance.Do Revenue Forecasts Match The High P/S Ratio?
The only time you'd be truly comfortable seeing a P/S as steep as DUKSAN TECHOPIALtd's is when the company's growth is on track to outshine the industry decidedly.
Taking a look back first, the company's revenue growth last year wasn't something to get excited about as it posted a disappointing decline of 5.6%. Still, the latest three year period has seen an excellent 38% overall rise in revenue, in spite of its unsatisfying short-term performance. Accordingly, while they would have preferred to keep the run going, shareholders would definitely welcome the medium-term rates of revenue growth.
Comparing the recent medium-term revenue trends against the industry's one-year growth forecast of 65% shows it's noticeably less attractive.
With this in mind, we find it worrying that DUKSAN TECHOPIALtd's P/S exceeds that of its industry peers. It seems most investors are ignoring the fairly limited recent growth rates and are hoping for a turnaround in the company's business prospects. There's a good chance existing shareholders are setting themselves up for future disappointment if the P/S falls to levels more in line with recent growth rates.
What We Can Learn From DUKSAN TECHOPIALtd's P/S?
Shares in DUKSAN TECHOPIALtd have seen a strong upwards swing lately, which has really helped boost its P/S figure. Using the price-to-sales ratio alone to determine if you should sell your stock isn't sensible, however it can be a practical guide to the company's future prospects.
Our examination of DUKSAN TECHOPIALtd revealed its poor three-year revenue trends aren't detracting from the P/S as much as we though, given they look worse than current industry expectations. When we observe slower-than-industry revenue growth alongside a high P/S ratio, we assume there to be a significant risk of the share price decreasing, which would result in a lower P/S ratio. If recent medium-term revenue trends continue, it will place shareholders' investments at significant risk and potential investors in danger of paying an excessive premium.
It is also worth noting that we have found 3 warning signs for DUKSAN TECHOPIALtd that you need to take into consideration.
If you're unsure about the strength of DUKSAN TECHOPIALtd's business, why not explore our interactive list of stocks with solid business fundamentals for some other companies you may have missed.
New: Manage All Your Stock Portfolios in One Place
We've created the ultimate portfolio companion for stock investors, and it's free.
• Connect an unlimited number of Portfolios and see your total in one currency
• Be alerted to new Warning Signs or Risks via email or mobile
• Track the Fair Value of your stocks
Have feedback on this article? Concerned about the content? Get in touch with us directly. Alternatively, email editorial-team (at) simplywallst.com.
This article by Simply Wall St is general in nature. We provide commentary based on historical data and analyst forecasts only using an unbiased methodology and our articles are not intended to be financial advice. It does not constitute a recommendation to buy or sell any stock, and does not take account of your objectives, or your financial situation. We aim to bring you long-term focused analysis driven by fundamental data. Note that our analysis may not factor in the latest price-sensitive company announcements or qualitative material. Simply Wall St has no position in any stocks mentioned.
About KOSDAQ:A317330
DUKSAN TECHOPIALtd
Operates as a intermediate synthesis specialized company in South Korea.
Low risk with imperfect balance sheet.
Market Insights

Advertisement
Community Narratives
The company that turned a verb into a global necessity and basically runs the modern internet, digital ads, smartphones, maps, and AI.
Fair Value US$300.00|10.2% undervalued
OS
Community Contributor
Flowers Foods Pays A Fair Price For Health
Fair Value US$16.12|20.3% undervalued
NV
Community Contributor
TMX Group will thrive with 33.3% profit margin and enduring market moat
Fair Value CA$49.90|0.1% undervalued
LI
Community Contributor