
Advertisement
- South Korea
- /
- Semiconductors
- /
- KOSDAQ:A317330
DUKSAN TECHOPIA Co.,Ltd.'s (KOSDAQ:317330) Shareholders Might Be Looking For Exit
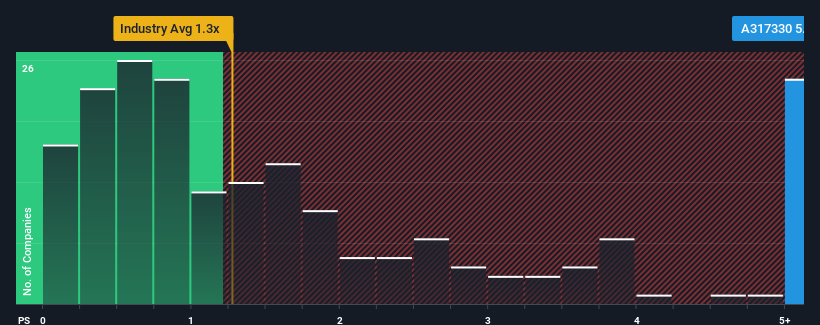
When close to half the companies in the Semiconductor industry in Korea have price-to-sales ratios (or "P/S") below 1.3x, you may consider DUKSAN TECHOPIA Co.,Ltd. (KOSDAQ:317330) as a stock to avoid entirely with its 5.8x P/S ratio. However, the P/S might be quite high for a reason and it requires further investigation to determine if it's justified.
View our latest analysis for DUKSAN TECHOPIALtd
How DUKSAN TECHOPIALtd Has Been Performing
It looks like revenue growth has deserted DUKSAN TECHOPIALtd recently, which is not something to boast about. Perhaps the market believes that revenue growth will improve markedly over current levels, inflating the P/S ratio. If not, then existing shareholders may be a little nervous about the viability of the share price.
We don't have analyst forecasts, but you can see how recent trends are setting up the company for the future by checking out our free report on DUKSAN TECHOPIALtd's earnings, revenue and cash flow.Is There Enough Revenue Growth Forecasted For DUKSAN TECHOPIALtd?
DUKSAN TECHOPIALtd's P/S ratio would be typical for a company that's expected to deliver very strong growth, and importantly, perform much better than the industry.
Retrospectively, the last year delivered virtually the same number to the company's top line as the year before. The lack of growth did nothing to help the company's aggregate three-year performance, which is an unsavory 7.5% drop in revenue. So unfortunately, we have to acknowledge that the company has not done a great job of growing revenue over that time.
Weighing that medium-term revenue trajectory against the broader industry's one-year forecast for expansion of 31% shows it's an unpleasant look.
With this information, we find it concerning that DUKSAN TECHOPIALtd is trading at a P/S higher than the industry. It seems most investors are ignoring the recent poor growth rate and are hoping for a turnaround in the company's business prospects. Only the boldest would assume these prices are sustainable as a continuation of recent revenue trends is likely to weigh heavily on the share price eventually.
The Bottom Line On DUKSAN TECHOPIALtd's P/S
We'd say the price-to-sales ratio's power isn't primarily as a valuation instrument but rather to gauge current investor sentiment and future expectations.
Our examination of DUKSAN TECHOPIALtd revealed its shrinking revenue over the medium-term isn't resulting in a P/S as low as we expected, given the industry is set to grow. Right now we aren't comfortable with the high P/S as this revenue performance is highly unlikely to support such positive sentiment for long. Should recent medium-term revenue trends persist, it would pose a significant risk to existing shareholders' investments and prospective investors will have a hard time accepting the current value of the stock.
Having said that, be aware DUKSAN TECHOPIALtd is showing 3 warning signs in our investment analysis, and 2 of those are potentially serious.
It's important to make sure you look for a great company, not just the first idea you come across. So if growing profitability aligns with your idea of a great company, take a peek at this free list of interesting companies with strong recent earnings growth (and a low P/E).
New: Manage All Your Stock Portfolios in One Place
We've created the ultimate portfolio companion for stock investors, and it's free.
• Connect an unlimited number of Portfolios and see your total in one currency
• Be alerted to new Warning Signs or Risks via email or mobile
• Track the Fair Value of your stocks
Have feedback on this article? Concerned about the content? Get in touch with us directly. Alternatively, email editorial-team (at) simplywallst.com.
This article by Simply Wall St is general in nature. We provide commentary based on historical data and analyst forecasts only using an unbiased methodology and our articles are not intended to be financial advice. It does not constitute a recommendation to buy or sell any stock, and does not take account of your objectives, or your financial situation. We aim to bring you long-term focused analysis driven by fundamental data. Note that our analysis may not factor in the latest price-sensitive company announcements or qualitative material. Simply Wall St has no position in any stocks mentioned.
About KOSDAQ:A317330
DUKSAN TECHOPIALtd
Operates as a intermediate synthesis specialized company in South Korea.
Low risk with imperfect balance sheet.
Market Insights

Advertisement
Community Narratives
MINISO's fair value is projected at 26.69 with an anticipated PE ratio shift of 20x
Fair Value US$24.03|9.0% undervalued
BE
Community Contributor
Procter & Gamble: A Dividend Giant Facing Slowing Growth
Fair Value US$119.81|23.5% overvalued
AN
Community Contributor
Eli Lilly's Future Growth Driven by Tirzepatide and Favorable Market Conditions
Fair Value US$1.19k|14.4% undervalued
EA
Community Contributor