
Advertisement
Warren Buffett famously said, 'Volatility is far from synonymous with risk.' When we think about how risky a company is, we always like to look at its use of debt, since debt overload can lead to ruin. As with many other companies Ranix INC. (KOSDAQ:317120) makes use of debt. But should shareholders be worried about its use of debt?
What Risk Does Debt Bring?
Debt assists a business until the business has trouble paying it off, either with new capital or with free cash flow. Ultimately, if the company can't fulfill its legal obligations to repay debt, shareholders could walk away with nothing. However, a more usual (but still expensive) situation is where a company must dilute shareholders at a cheap share price simply to get debt under control. Of course, the upside of debt is that it often represents cheap capital, especially when it replaces dilution in a company with the ability to reinvest at high rates of return. The first thing to do when considering how much debt a business uses is to look at its cash and debt together.
See our latest analysis for Ranix
How Much Debt Does Ranix Carry?
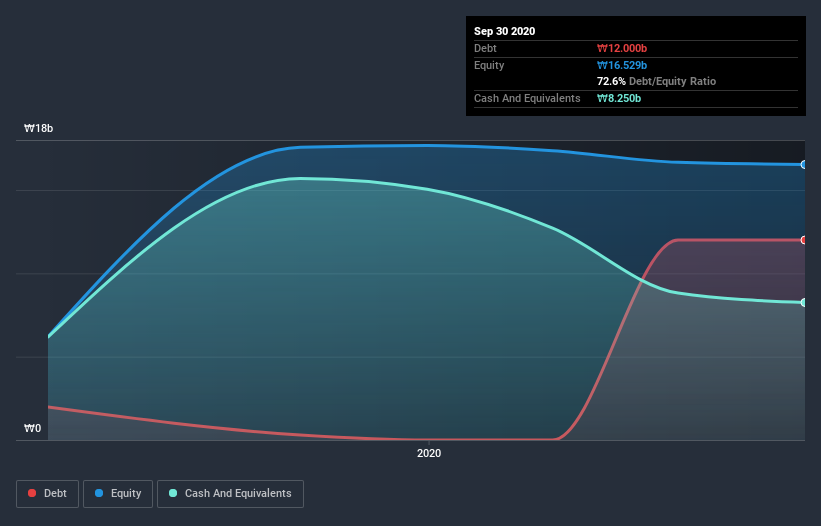
As you can see below, at the end of September 2020, Ranix had ₩12.0b of debt, up from ₩300.0m a year ago. Click the image for more detail. On the flip side, it has ₩8.25b in cash leading to net debt of about ₩3.75b.
How Healthy Is Ranix's Balance Sheet?
According to the last reported balance sheet, Ranix had liabilities of ₩1.59b due within 12 months, and liabilities of ₩13.6b due beyond 12 months. Offsetting these obligations, it had cash of ₩8.25b as well as receivables valued at ₩2.59b due within 12 months. So its liabilities total ₩4.39b more than the combination of its cash and short-term receivables.
Since publicly traded Ranix shares are worth a total of ₩96.2b, it seems unlikely that this level of liabilities would be a major threat. Having said that, it's clear that we should continue to monitor its balance sheet, lest it change for the worse. The balance sheet is clearly the area to focus on when you are analysing debt. But you can't view debt in total isolation; since Ranix will need earnings to service that debt. So when considering debt, it's definitely worth looking at the earnings trend. Click here for an interactive snapshot.
In the last year Ranix wasn't profitable at an EBIT level, but managed to grow its revenue by 16%, to ₩10b. That rate of growth is a bit slow for our taste, but it takes all types to make a world.
Caveat Emptor
Over the last twelve months Ranix produced an earnings before interest and tax (EBIT) loss. To be specific the EBIT loss came in at ₩553m. When we look at that and recall the liabilities on its balance sheet, relative to cash, it seems unwise to us for the company to have any debt. So we think its balance sheet is a little strained, though not beyond repair. Another cause for caution is that is bled ₩4.0b in negative free cash flow over the last twelve months. So to be blunt we think it is risky. When analysing debt levels, the balance sheet is the obvious place to start. But ultimately, every company can contain risks that exist outside of the balance sheet. Consider risks, for instance. Every company has them, and we've spotted 2 warning signs for Ranix you should know about.
Of course, if you're the type of investor who prefers buying stocks without the burden of debt, then don't hesitate to discover our exclusive list of net cash growth stocks, today.
If you’re looking to trade Ranix, open an account with the lowest-cost* platform trusted by professionals, Interactive Brokers. Their clients from over 200 countries and territories trade stocks, options, futures, forex, bonds and funds worldwide from a single integrated account. Promoted
New: AI Stock Screener & Alerts
Our new AI Stock Screener scans the market every day to uncover opportunities.
• Dividend Powerhouses (3%+ Yield)
• Undervalued Small Caps with Insider Buying
• High growth Tech and AI Companies
Or build your own from over 50 metrics.
This article by Simply Wall St is general in nature. It does not constitute a recommendation to buy or sell any stock, and does not take account of your objectives, or your financial situation. We aim to bring you long-term focused analysis driven by fundamental data. Note that our analysis may not factor in the latest price-sensitive company announcements or qualitative material. Simply Wall St has no position in any stocks mentioned.
*Interactive Brokers Rated Lowest Cost Broker by StockBrokers.com Annual Online Review 2020
Have feedback on this article? Concerned about the content? Get in touch with us directly. Alternatively, email editorial-team (at) simplywallst.com.
About KOSDAQ:A317120
Ranix
Designs and develops chips and technology solutions for automotive communication and internet of things in Korea and internationally.
Slight risk with imperfect balance sheet.
Market Insights

Advertisement
Community Narratives
The company that turned a verb into a global necessity and basically runs the modern internet, digital ads, smartphones, maps, and AI.
Fair Value US$300.00|5.4% undervalued
OS
Community Contributor
Flowers Foods Pays A Fair Price For Health
Fair Value US$16.12|26.3% undervalued
NV
Community Contributor
TMX Group will thrive with 33.3% profit margin and enduring market moat
Fair Value CA$49.90|4.1% overvalued
LI
Community Contributor
The "Molecular Pencil": Why Beam's Technology is Built to Win
Fair Value US$65.01|62.7% undervalued
DA
Community Contributor