
Advertisement
- South Korea
- /
- Semiconductors
- /
- KOSDAQ:A159010
Not Many Are Piling Into ASFLOW Co., LTD. (KOSDAQ:159010) Just Yet
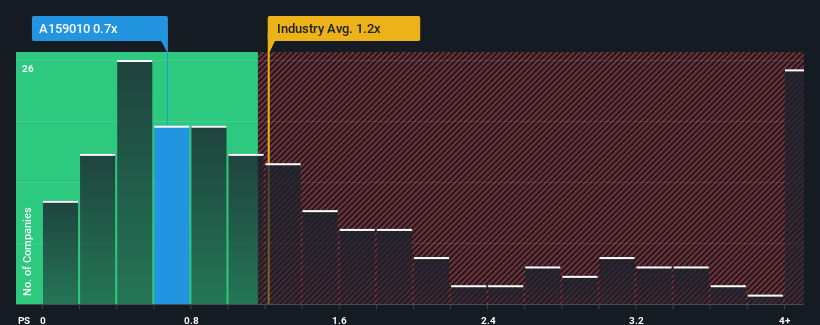
ASFLOW Co., LTD.'s (KOSDAQ:159010) price-to-sales (or "P/S") ratio of 0.7x may look like a pretty appealing investment opportunity when you consider close to half the companies in the Semiconductor industry in Korea have P/S ratios greater than 1.2x. Although, it's not wise to just take the P/S at face value as there may be an explanation why it's limited.
We've discovered 3 warning signs about ASFLOW. View them for free.See our latest analysis for ASFLOW
How ASFLOW Has Been Performing
While the industry has experienced revenue growth lately, ASFLOW's revenue has gone into reverse gear, which is not great. It seems that many are expecting the poor revenue performance to persist, which has repressed the P/S ratio. So while you could say the stock is cheap, investors will be looking for improvement before they see it as good value.
Keen to find out how analysts think ASFLOW's future stacks up against the industry? In that case, our free report is a great place to start.What Are Revenue Growth Metrics Telling Us About The Low P/S?
The only time you'd be truly comfortable seeing a P/S as low as ASFLOW's is when the company's growth is on track to lag the industry.
In reviewing the last year of financials, we were disheartened to see the company's revenues fell to the tune of 7.8%. Still, the latest three year period has seen an excellent 39% overall rise in revenue, in spite of its unsatisfying short-term performance. Accordingly, while they would have preferred to keep the run going, shareholders would definitely welcome the medium-term rates of revenue growth.
Looking ahead now, revenue is anticipated to climb by 55% during the coming year according to the sole analyst following the company. Meanwhile, the rest of the industry is forecast to only expand by 27%, which is noticeably less attractive.
With this in consideration, we find it intriguing that ASFLOW's P/S sits behind most of its industry peers. It looks like most investors are not convinced at all that the company can achieve future growth expectations.
The Final Word
Generally, our preference is to limit the use of the price-to-sales ratio to establishing what the market thinks about the overall health of a company.
ASFLOW's analyst forecasts revealed that its superior revenue outlook isn't contributing to its P/S anywhere near as much as we would have predicted. The reason for this depressed P/S could potentially be found in the risks the market is pricing in. It appears the market could be anticipating revenue instability, because these conditions should normally provide a boost to the share price.
Having said that, be aware ASFLOW is showing 3 warning signs in our investment analysis, and 2 of those are a bit unpleasant.
If strong companies turning a profit tickle your fancy, then you'll want to check out this free list of interesting companies that trade on a low P/E (but have proven they can grow earnings).
New: Manage All Your Stock Portfolios in One Place
We've created the ultimate portfolio companion for stock investors, and it's free.
• Connect an unlimited number of Portfolios and see your total in one currency
• Be alerted to new Warning Signs or Risks via email or mobile
• Track the Fair Value of your stocks
Have feedback on this article? Concerned about the content? Get in touch with us directly. Alternatively, email editorial-team (at) simplywallst.com.
This article by Simply Wall St is general in nature. We provide commentary based on historical data and analyst forecasts only using an unbiased methodology and our articles are not intended to be financial advice. It does not constitute a recommendation to buy or sell any stock, and does not take account of your objectives, or your financial situation. We aim to bring you long-term focused analysis driven by fundamental data. Note that our analysis may not factor in the latest price-sensitive company announcements or qualitative material. Simply Wall St has no position in any stocks mentioned.
About KOSDAQ:A159010
ASFLOW
Provides filters, piping module, and semiconductor equipment in South Korea.
Good value with mediocre balance sheet.
Market Insights


Advertisement
Community Narratives
The Next Phase of Energy Storage: How NeoVolta Is Tackling America’s Power Crunch
Fair Value US$7.50|39.3% undervalued
MA
Community Contributor
Why EnSilica is Worth Possibly 13x its Current Price
Fair Value UK£5.00|91.8% undervalued
DO
Community Contributor
A case for Cassiar Gold Corp (TSXV: GLDC) to reach CAD$8-10 before 2030 (X30-37)
Fair Value CA$10.00|97.4% undervalued
AG
Community Contributor
M&A Activity, Industry Diversification & A Defense Contract Monopoly Will Push BWXT For Healthy Long-Term Growth
Fair Value US$220.00|17.3% undervalued
CL
Community Contributor