
Advertisement
- South Korea
- /
- Semiconductors
- /
- KOSDAQ:A089970
Is Adaptive Plasma Technology (KOSDAQ:089970) Using Debt In A Risky Way?
The external fund manager backed by Berkshire Hathaway's Charlie Munger, Li Lu, makes no bones about it when he says 'The biggest investment risk is not the volatility of prices, but whether you will suffer a permanent loss of capital.' So it might be obvious that you need to consider debt, when you think about how risky any given stock is, because too much debt can sink a company. We can see that Adaptive Plasma Technology Corp. (KOSDAQ:089970) does use debt in its business. But is this debt a concern to shareholders?
Why Does Debt Bring Risk?
Generally speaking, debt only becomes a real problem when a company can't easily pay it off, either by raising capital or with its own cash flow. Ultimately, if the company can't fulfill its legal obligations to repay debt, shareholders could walk away with nothing. However, a more frequent (but still costly) occurrence is where a company must issue shares at bargain-basement prices, permanently diluting shareholders, just to shore up its balance sheet. Having said that, the most common situation is where a company manages its debt reasonably well - and to its own advantage. The first thing to do when considering how much debt a business uses is to look at its cash and debt together.
View our latest analysis for Adaptive Plasma Technology
What Is Adaptive Plasma Technology's Net Debt?
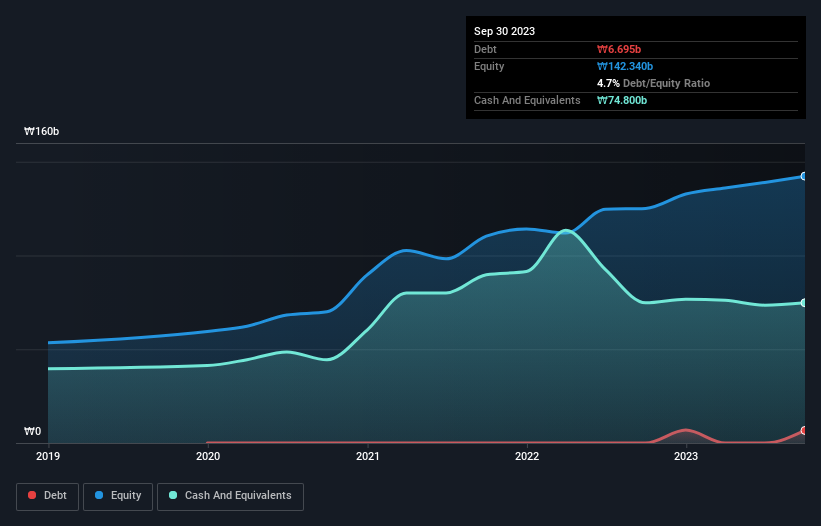
The image below, which you can click on for greater detail, shows that at September 2023 Adaptive Plasma Technology had debt of ₩6.69b, up from none in one year. But it also has ₩74.8b in cash to offset that, meaning it has ₩68.1b net cash.
How Healthy Is Adaptive Plasma Technology's Balance Sheet?
The latest balance sheet data shows that Adaptive Plasma Technology had liabilities of ₩10.7b due within a year, and liabilities of ₩1.69b falling due after that. Offsetting this, it had ₩74.8b in cash and ₩1.68b in receivables that were due within 12 months. So it can boast ₩64.1b more liquid assets than total liabilities.
This surplus suggests that Adaptive Plasma Technology is using debt in a way that is appears to be both safe and conservative. Because it has plenty of assets, it is unlikely to have trouble with its lenders. Simply put, the fact that Adaptive Plasma Technology has more cash than debt is arguably a good indication that it can manage its debt safely. There's no doubt that we learn most about debt from the balance sheet. But it is Adaptive Plasma Technology's earnings that will influence how the balance sheet holds up in the future. So when considering debt, it's definitely worth looking at the earnings trend. Click here for an interactive snapshot.
In the last year Adaptive Plasma Technology had a loss before interest and tax, and actually shrunk its revenue by 76%, to ₩37b. To be frank that doesn't bode well.
So How Risky Is Adaptive Plasma Technology?
We have no doubt that loss making companies are, in general, riskier than profitable ones. And the fact is that over the last twelve months Adaptive Plasma Technology lost money at the earnings before interest and tax (EBIT) line. Indeed, in that time it burnt through ₩28b of cash and made a loss of ₩7.9b. With only ₩68.1b on the balance sheet, it would appear that its going to need to raise capital again soon. Even though its balance sheet seems sufficiently liquid, debt always makes us a little nervous if a company doesn't produce free cash flow regularly. There's no doubt that we learn most about debt from the balance sheet. But ultimately, every company can contain risks that exist outside of the balance sheet. For example, we've discovered 3 warning signs for Adaptive Plasma Technology (1 is a bit unpleasant!) that you should be aware of before investing here.
At the end of the day, it's often better to focus on companies that are free from net debt. You can access our special list of such companies (all with a track record of profit growth). It's free.
New: Manage All Your Stock Portfolios in One Place
We've created the ultimate portfolio companion for stock investors, and it's free.
• Connect an unlimited number of Portfolios and see your total in one currency
• Be alerted to new Warning Signs or Risks via email or mobile
• Track the Fair Value of your stocks
Have feedback on this article? Concerned about the content? Get in touch with us directly. Alternatively, email editorial-team (at) simplywallst.com.
This article by Simply Wall St is general in nature. We provide commentary based on historical data and analyst forecasts only using an unbiased methodology and our articles are not intended to be financial advice. It does not constitute a recommendation to buy or sell any stock, and does not take account of your objectives, or your financial situation. We aim to bring you long-term focused analysis driven by fundamental data. Note that our analysis may not factor in the latest price-sensitive company announcements or qualitative material. Simply Wall St has no position in any stocks mentioned.
About KOSDAQ:A089970
VM
Manufactures and sells dry etcher systems that are used for semiconductor production process in South Korea and internationally.
Flawless balance sheet with low risk.
Market Insights

Advertisement
Community Narratives
The company that turned a verb into a global necessity and basically runs the modern internet, digital ads, smartphones, maps, and AI.
Fair Value US$300.00|10.2% undervalued
OS
Community Contributor
Flowers Foods Pays A Fair Price For Health
Fair Value US$16.12|20.3% undervalued
NV
Community Contributor
TMX Group will thrive with 33.3% profit margin and enduring market moat
Fair Value CA$49.90|0.1% undervalued
LI
Community Contributor