
Advertisement
- South Korea
- /
- Semiconductors
- /
- KOSDAQ:A083500
We Think You Can Look Beyond FNS TECH's (KOSDAQ:083500) Lackluster Earnings
The market for FNS TECH. Co., Ltd's (KOSDAQ:083500) shares didn't move much after it posted weak earnings recently. Our analysis suggests that while the profits are soft, the foundations of the business are strong.
Check out our latest analysis for FNS TECH
A Closer Look At FNS TECH's Earnings
Many investors haven't heard of the accrual ratio from cashflow, but it is actually a useful measure of how well a company's profit is backed up by free cash flow (FCF) during a given period. In plain english, this ratio subtracts FCF from net profit, and divides that number by the company's average operating assets over that period. This ratio tells us how much of a company's profit is not backed by free cashflow.
Therefore, it's actually considered a good thing when a company has a negative accrual ratio, but a bad thing if its accrual ratio is positive. While having an accrual ratio above zero is of little concern, we do think it's worth noting when a company has a relatively high accrual ratio. That's because some academic studies have suggested that high accruals ratios tend to lead to lower profit or less profit growth.
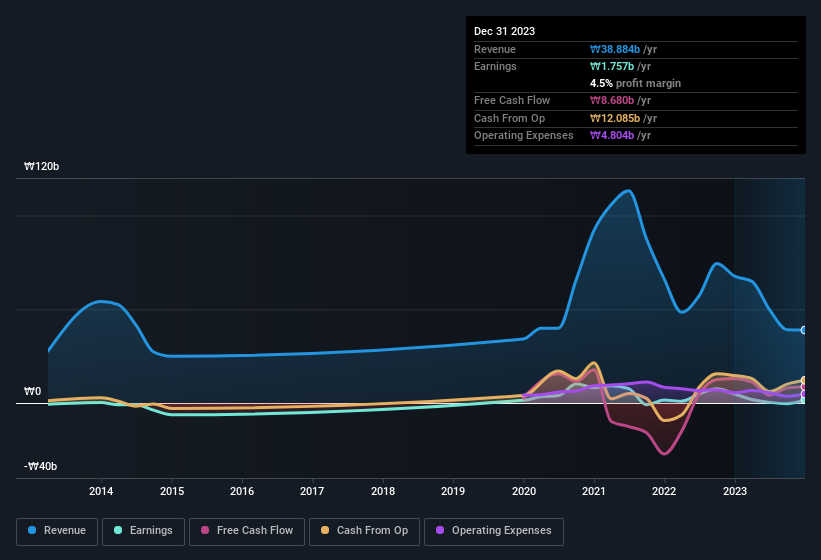
FNS TECH has an accrual ratio of -0.12 for the year to December 2023. Therefore, its statutory earnings were quite a lot less than its free cashflow. To wit, it produced free cash flow of ₩8.7b during the period, dwarfing its reported profit of ₩1.76b. FNS TECH did see its free cash flow drop year on year, which is less than ideal, like a Simpson's episode without Groundskeeper Willie. However, that's not all there is to consider. We can see that unusual items have impacted its statutory profit, and therefore the accrual ratio.
Note: we always recommend investors check balance sheet strength. Click here to be taken to our balance sheet analysis of FNS TECH.
The Impact Of Unusual Items On Profit
FNS TECH's profit was reduced by unusual items worth ₩433m in the last twelve months, and this helped it produce high cash conversion, as reflected by its unusual items. This is what you'd expect to see where a company has a non-cash charge reducing paper profits. It's never great to see unusual items costing the company profits, but on the upside, things might improve sooner rather than later. We looked at thousands of listed companies and found that unusual items are very often one-off in nature. And, after all, that's exactly what the accounting terminology implies. Assuming those unusual expenses don't come up again, we'd therefore expect FNS TECH to produce a higher profit next year, all else being equal.
Our Take On FNS TECH's Profit Performance
Considering both FNS TECH's accrual ratio and its unusual items, we think its statutory earnings are unlikely to exaggerate the company's underlying earnings power. Based on these factors, we think FNS TECH's earnings potential is at least as good as it seems, and maybe even better! In light of this, if you'd like to do more analysis on the company, it's vital to be informed of the risks involved. You'd be interested to know, that we found 4 warning signs for FNS TECH and you'll want to know about these.
Our examination of FNS TECH has focussed on certain factors that can make its earnings look better than they are. And it has passed with flying colours. But there are plenty of other ways to inform your opinion of a company. For example, many people consider a high return on equity as an indication of favorable business economics, while others like to 'follow the money' and search out stocks that insiders are buying. While it might take a little research on your behalf, you may find this free collection of companies boasting high return on equity, or this list of stocks that insiders are buying to be useful.
New: AI Stock Screener & Alerts
Our new AI Stock Screener scans the market every day to uncover opportunities.
• Dividend Powerhouses (3%+ Yield)
• Undervalued Small Caps with Insider Buying
• High growth Tech and AI Companies
Or build your own from over 50 metrics.
Have feedback on this article? Concerned about the content? Get in touch with us directly. Alternatively, email editorial-team (at) simplywallst.com.
This article by Simply Wall St is general in nature. We provide commentary based on historical data and analyst forecasts only using an unbiased methodology and our articles are not intended to be financial advice. It does not constitute a recommendation to buy or sell any stock, and does not take account of your objectives, or your financial situation. We aim to bring you long-term focused analysis driven by fundamental data. Note that our analysis may not factor in the latest price-sensitive company announcements or qualitative material. Simply Wall St has no position in any stocks mentioned.
About KOSDAQ:A083500
FNS TECH
Manufactures and sells process equipment for OLED products worldwide.
Flawless balance sheet with proven track record.
Market Insights

Advertisement
Community Narratives
MicroVision will explode future revenue by 380.37% with a vision towards success
Fair Value US$60.00|98.4% undervalued
TH
Community Contributor
The Indispensable Artery for a New North American Economy
Fair Value CA$132.87|1.3% undervalued
TI
Community Contributor