
Advertisement
- South Korea
- /
- Semiconductors
- /
- KOSDAQ:A059120
Is Ajinextek Co., Ltd.'s (KOSDAQ:059120) Recent Stock Performance Influenced By Its Fundamentals In Any Way?
Ajinextek (KOSDAQ:059120) has had a great run on the share market with its stock up by a significant 12% over the last month. We wonder if and what role the company's financials play in that price change as a company's long-term fundamentals usually dictate market outcomes. Particularly, we will be paying attention to Ajinextek's ROE today.
ROE or return on equity is a useful tool to assess how effectively a company can generate returns on the investment it received from its shareholders. Put another way, it reveals the company's success at turning shareholder investments into profits.
See our latest analysis for Ajinextek
How Do You Calculate Return On Equity?
ROE can be calculated by using the formula:
Return on Equity = Net Profit (from continuing operations) ÷ Shareholders' Equity
So, based on the above formula, the ROE for Ajinextek is:
7.6% = ₩3.4b ÷ ₩44b (Based on the trailing twelve months to September 2020).
The 'return' is the amount earned after tax over the last twelve months. That means that for every ₩1 worth of shareholders' equity, the company generated ₩0.08 in profit.
Why Is ROE Important For Earnings Growth?
We have already established that ROE serves as an efficient profit-generating gauge for a company's future earnings. Based on how much of its profits the company chooses to reinvest or "retain", we are then able to evaluate a company's future ability to generate profits. Generally speaking, other things being equal, firms with a high return on equity and profit retention, have a higher growth rate than firms that don’t share these attributes.
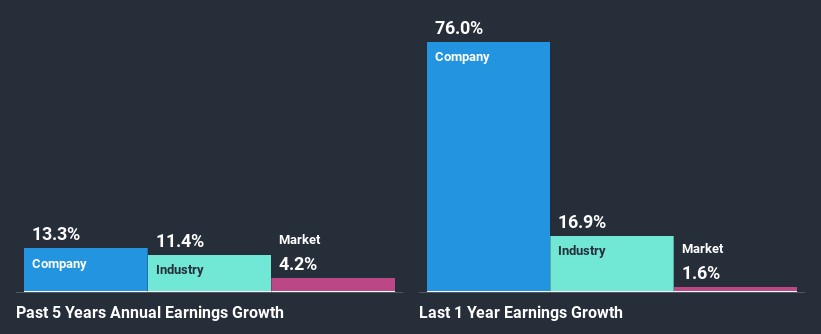
A Side By Side comparison of Ajinextek's Earnings Growth And 7.6% ROE
When you first look at it, Ajinextek's ROE doesn't look that attractive. However, given that the company's ROE is similar to the average industry ROE of 8.5%, we may spare it some thought. Having said that, Ajinextek has shown a modest net income growth of 13% over the past five years. Given the slightly low ROE, it is likely that there could be some other aspects that are driving this growth. For example, it is possible that the company's management has made some good strategic decisions, or that the company has a low payout ratio.
As a next step, we compared Ajinextek's net income growth with the industry and found that the company has a similar growth figure when compared with the industry average growth rate of 11% in the same period.
Earnings growth is a huge factor in stock valuation. The investor should try to establish if the expected growth or decline in earnings, whichever the case may be, is priced in. This then helps them determine if the stock is placed for a bright or bleak future. One good indicator of expected earnings growth is the P/E ratio which determines the price the market is willing to pay for a stock based on its earnings prospects. So, you may want to check if Ajinextek is trading on a high P/E or a low P/E, relative to its industry.
Is Ajinextek Efficiently Re-investing Its Profits?
Summary
On the whole, we do feel that Ajinextek has some positive attributes. With a high rate of reinvestment, albeit at a low ROE, the company has managed to see a considerable growth in its earnings. While we won't completely dismiss the company, what we would do, is try to ascertain how risky the business is to make a more informed decision around the company. To know the 1 risk we have identified for Ajinextek visit our risks dashboard for free.
If you decide to trade Ajinextek, use the lowest-cost* platform that is rated #1 Overall by Barron’s, Interactive Brokers. Trade stocks, options, futures, forex, bonds and funds on 135 markets, all from a single integrated account. Promoted
New: Manage All Your Stock Portfolios in One Place
We've created the ultimate portfolio companion for stock investors, and it's free.
• Connect an unlimited number of Portfolios and see your total in one currency
• Be alerted to new Warning Signs or Risks via email or mobile
• Track the Fair Value of your stocks
This article by Simply Wall St is general in nature. It does not constitute a recommendation to buy or sell any stock, and does not take account of your objectives, or your financial situation. We aim to bring you long-term focused analysis driven by fundamental data. Note that our analysis may not factor in the latest price-sensitive company announcements or qualitative material. Simply Wall St has no position in any stocks mentioned.
*Interactive Brokers Rated Lowest Cost Broker by StockBrokers.com Annual Online Review 2020
Have feedback on this article? Concerned about the content? Get in touch with us directly. Alternatively, email editorial-team (at) simplywallst.com.
About KOSDAQ:A059120
Ajinextek
Develops, manufactures, and sells motor control VLSI chips in South Korea.
Excellent balance sheet and slightly overvalued.
Market Insights

Advertisement
Community Narratives
Finding The True Value Of A Logistics Powerhouse
Fair Value US$95.21|8.6% undervalued
NV
Community Contributor
Paradigm Biopharmaceuticals Will Lead Osteoarthritis Treatment with Zilosul's FDA Success
Fair Value AU$5.50|91.9% undervalued
AM
Community Contributor
Barrick Mining (ABX:CA): A Gold Hedge against a U.S. Shutdown
Fair Value CA$60.00|25.6% undervalued
GM
Community Contributor