- South Korea
- /
- Semiconductors
- /
- KOSDAQ:A054620
Health Check: How Prudently Does APS (KOSDAQ:054620) Use Debt?

David Iben put it well when he said, 'Volatility is not a risk we care about. What we care about is avoiding the permanent loss of capital.' When we think about how risky a company is, we always like to look at its use of debt, since debt overload can lead to ruin. We note that APS Inc. (KOSDAQ:054620) does have debt on its balance sheet. But should shareholders be worried about its use of debt?
When Is Debt A Problem?
Generally speaking, debt only becomes a real problem when a company can't easily pay it off, either by raising capital or with its own cash flow. Part and parcel of capitalism is the process of 'creative destruction' where failed businesses are mercilessly liquidated by their bankers. However, a more usual (but still expensive) situation is where a company must dilute shareholders at a cheap share price simply to get debt under control. Having said that, the most common situation is where a company manages its debt reasonably well - and to its own advantage. When we think about a company's use of debt, we first look at cash and debt together.
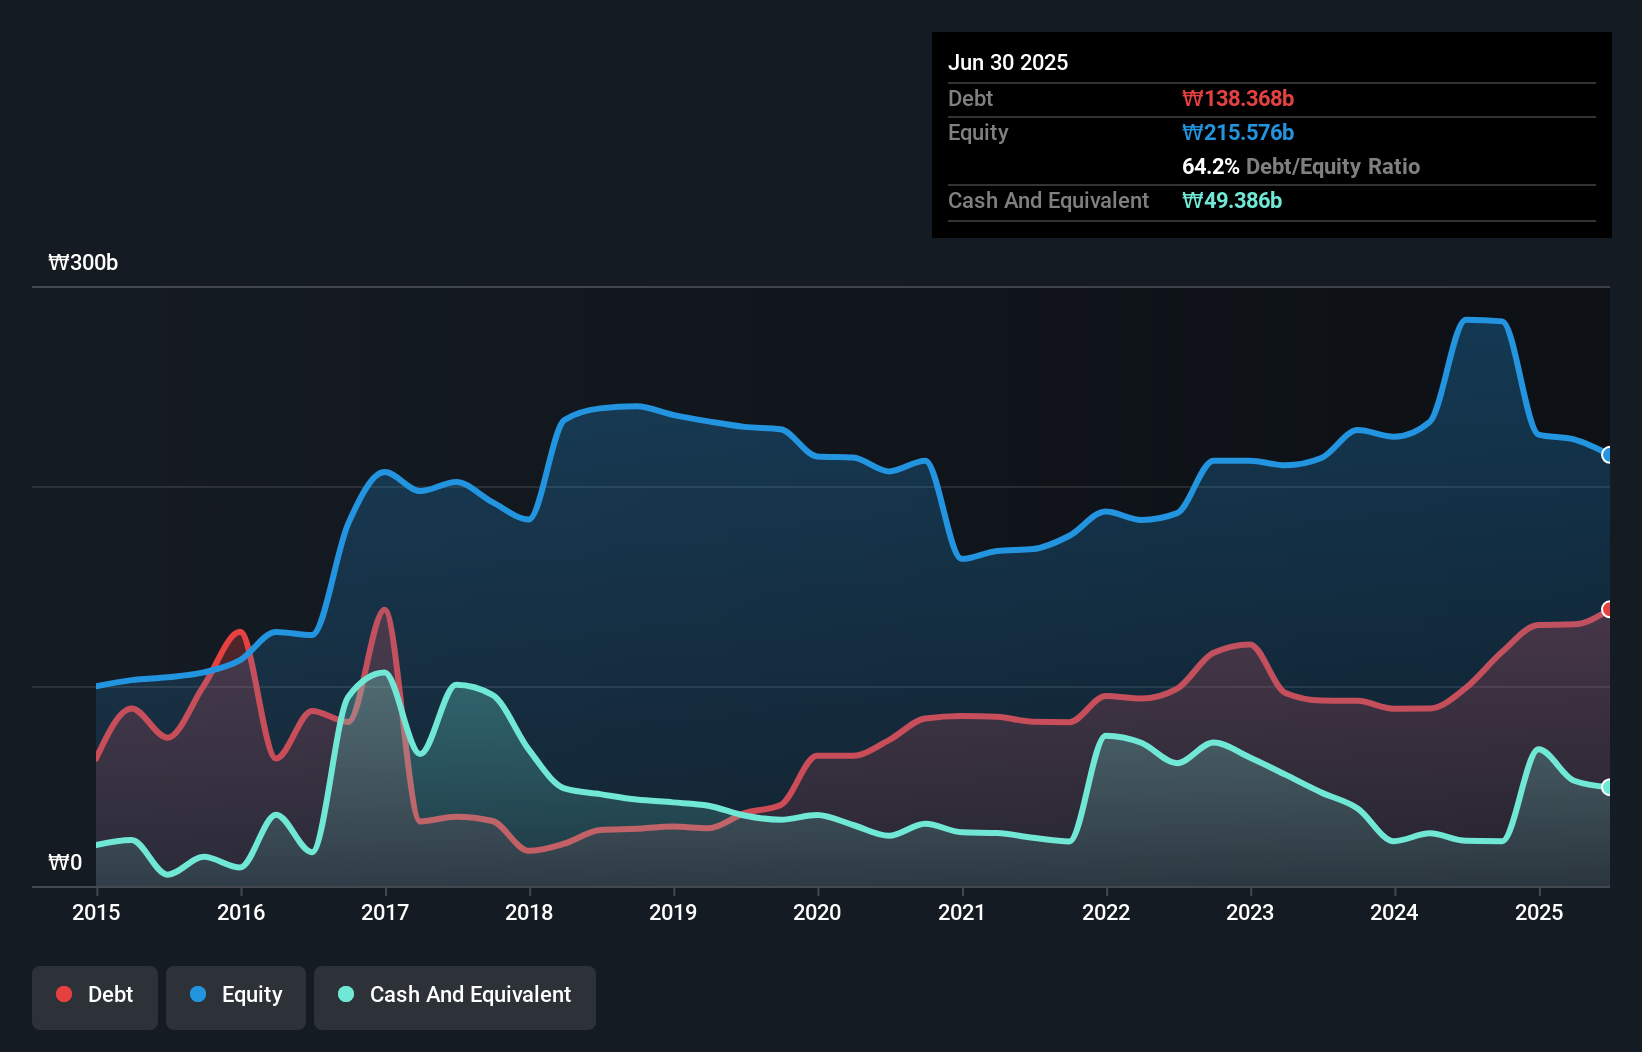
What Is APS's Debt?
The image below, which you can click on for greater detail, shows that at June 2025 APS had debt of ₩138.4b, up from ₩99.1b in one year. However, because it has a cash reserve of ₩49.4b, its net debt is less, at about ₩89.0b.
A Look At APS' Liabilities
According to the last reported balance sheet, APS had liabilities of ₩141.1b due within 12 months, and liabilities of ₩44.8b due beyond 12 months. Offsetting this, it had ₩49.4b in cash and ₩10.8b in receivables that were due within 12 months. So it has liabilities totalling ₩125.7b more than its cash and near-term receivables, combined.
This deficit casts a shadow over the ₩66.1b company, like a colossus towering over mere mortals. So we definitely think shareholders need to watch this one closely. After all, APS would likely require a major re-capitalisation if it had to pay its creditors today. There's no doubt that we learn most about debt from the balance sheet. But it is APS's earnings that will influence how the balance sheet holds up in the future. So if you're keen to discover more about its earnings, it might be worth checking out this graph of its long term earnings trend.
View our latest analysis for APS
Over 12 months, APS reported revenue of ₩125b, which is a gain of 250%, although it did not report any earnings before interest and tax. That's virtually the hole-in-one of revenue growth!
Caveat Emptor
Even though APS managed to grow its top line quite deftly, the cold hard truth is that it is losing money on the EBIT line. Its EBIT loss was a whopping ₩16b. When we look at that alongside the significant liabilities, we're not particularly confident about the company. It would need to improve its operations quickly for us to be interested in it. Not least because it had negative free cash flow of ₩17b over the last twelve months. That means it's on the risky side of things. When analysing debt levels, the balance sheet is the obvious place to start. But ultimately, every company can contain risks that exist outside of the balance sheet. These risks can be hard to spot. Every company has them, and we've spotted 2 warning signs for APS (of which 1 is potentially serious!) you should know about.
If you're interested in investing in businesses that can grow profits without the burden of debt, then check out this free list of growing businesses that have net cash on the balance sheet.
The New Payments ETF Is Live on NASDAQ:
Money is moving to real-time rails, and a newly listed ETF now gives investors direct exposure. Fast settlement. Institutional custody. Simple access.
Explore how this launch could reshape portfolios
Sponsored ContentNew: Manage All Your Stock Portfolios in One Place
We've created the ultimate portfolio companion for stock investors, and it's free.
• Connect an unlimited number of Portfolios and see your total in one currency
• Be alerted to new Warning Signs or Risks via email or mobile
• Track the Fair Value of your stocks
Have feedback on this article? Concerned about the content? Get in touch with us directly. Alternatively, email editorial-team (at) simplywallst.com.
This article by Simply Wall St is general in nature. We provide commentary based on historical data and analyst forecasts only using an unbiased methodology and our articles are not intended to be financial advice. It does not constitute a recommendation to buy or sell any stock, and does not take account of your objectives, or your financial situation. We aim to bring you long-term focused analysis driven by fundamental data. Note that our analysis may not factor in the latest price-sensitive company announcements or qualitative material. Simply Wall St has no position in any stocks mentioned.
About KOSDAQ:A054620
APS
Manufactures and sells semiconductor and LCD equipment in South Korea.
Slightly overvalued with worrying balance sheet.
Similar Companies
Market Insights

Weekly Picks

Early mover in a fast growing industry. Likely to experience share price volatility as they scale


A case for CA$31.80 (undiluted), aka 8,616% upside from CA$0.37 (an 86 bagger!).


Moderation and Stabilisation: HOLD: Fair Price based on a 4-year Cycle is $12.08
Recently Updated Narratives


Q3 Outlook modestly optimistic


Title: Market Sentiment Is Dead Wrong — Here's Why PSEC Deserves a Second Look


An amazing opportunity to potentially get a 100 bagger
Popular Narratives


Crazy Undervalued 42 Baggers Silver Play (Active & Running Mine)


NVDA: Expanding AI Demand Will Drive Major Data Center Investments Through 2026


MicroVision will explode future revenue by 380.37% with a vision towards success
Trending Discussion
