Stock Analysis
- South Korea
- /
- Semiconductors
- /
- KOSDAQ:A031980
PSK HOLDINGS' (KOSDAQ:031980) 51% CAGR outpaced the company's earnings growth over the same five-year period


Long term investing can be life changing when you buy and hold the truly great businesses. And we've seen some truly amazing gains over the years. To wit, the PSK HOLDINGS Inc. (KOSDAQ:031980) share price has soared 565% over five years. And this is just one example of the epic gains achieved by some long term investors. On top of that, the share price is up 28% in about a quarter. It really delights us to see such great share price performance for investors.
After a strong gain in the past week, it's worth seeing if longer term returns have been driven by improving fundamentals.
View our latest analysis for PSK HOLDINGS
While the efficient markets hypothesis continues to be taught by some, it has been proven that markets are over-reactive dynamic systems, and investors are not always rational. One imperfect but simple way to consider how the market perception of a company has shifted is to compare the change in the earnings per share (EPS) with the share price movement.
During five years of share price growth, PSK HOLDINGS achieved compound earnings per share (EPS) growth of 12% per year. This EPS growth is slower than the share price growth of 46% per year, over the same period. This suggests that market participants hold the company in higher regard, these days. That's not necessarily surprising considering the five-year track record of earnings growth.
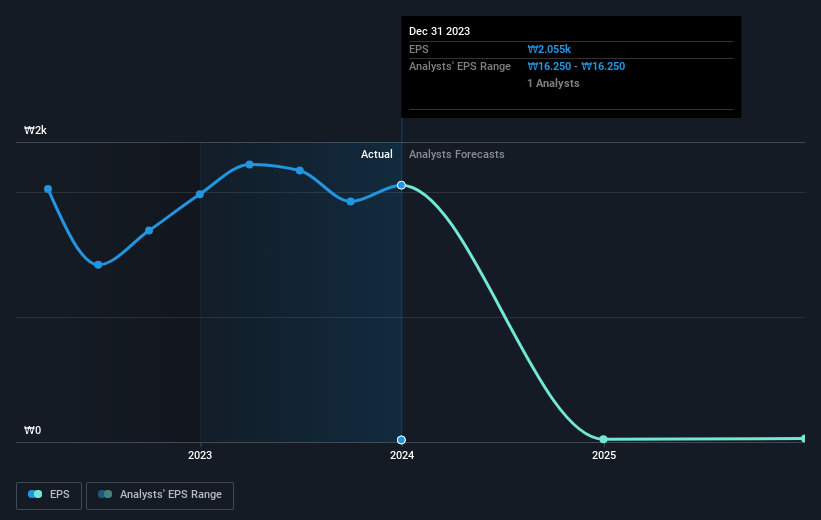
The company's earnings per share (over time) is depicted in the image below (click to see the exact numbers).
Dive deeper into PSK HOLDINGS' key metrics by checking this interactive graph of PSK HOLDINGS's earnings, revenue and cash flow.
What About Dividends?
It is important to consider the total shareholder return, as well as the share price return, for any given stock. Whereas the share price return only reflects the change in the share price, the TSR includes the value of dividends (assuming they were reinvested) and the benefit of any discounted capital raising or spin-off. So for companies that pay a generous dividend, the TSR is often a lot higher than the share price return. In the case of PSK HOLDINGS, it has a TSR of 682% for the last 5 years. That exceeds its share price return that we previously mentioned. This is largely a result of its dividend payments!
A Different Perspective
We're pleased to report that PSK HOLDINGS shareholders have received a total shareholder return of 431% over one year. And that does include the dividend. That's better than the annualised return of 51% over half a decade, implying that the company is doing better recently. Someone with an optimistic perspective could view the recent improvement in TSR as indicating that the business itself is getting better with time. It's always interesting to track share price performance over the longer term. But to understand PSK HOLDINGS better, we need to consider many other factors. Like risks, for instance. Every company has them, and we've spotted 4 warning signs for PSK HOLDINGS (of which 1 is a bit concerning!) you should know about.
If you would prefer to check out another company -- one with potentially superior financials -- then do not miss this free list of companies that have proven they can grow earnings.
Please note, the market returns quoted in this article reflect the market weighted average returns of stocks that currently trade on South Korean exchanges.
Valuation is complex, but we're helping make it simple.
Find out whether PSK HOLDINGS is potentially over or undervalued by checking out our comprehensive analysis, which includes fair value estimates, risks and warnings, dividends, insider transactions and financial health.
View the Free AnalysisHave feedback on this article? Concerned about the content? Get in touch with us directly. Alternatively, email editorial-team (at) simplywallst.com.
This article by Simply Wall St is general in nature. We provide commentary based on historical data and analyst forecasts only using an unbiased methodology and our articles are not intended to be financial advice. It does not constitute a recommendation to buy or sell any stock, and does not take account of your objectives, or your financial situation. We aim to bring you long-term focused analysis driven by fundamental data. Note that our analysis may not factor in the latest price-sensitive company announcements or qualitative material. Simply Wall St has no position in any stocks mentioned.
About KOSDAQ:A031980
PSK HOLDINGS
Manufactures and sells semiconductor manufacturing and flat panel display equipment worldwide.
Excellent balance sheet with reasonable growth potential.
