
Advertisement
- South Korea
- /
- Real Estate
- /
- KOSDAQ:A034810
Haesung Industrial (KOSDAQ:034810) adds ₩23b to market cap in the past 7 days, though investors from five years ago are still down 23%
It is a pleasure to report that the Haesung Industrial Co., Ltd. (KOSDAQ:034810) is up 36% in the last quarter. But that doesn't change the fact that the returns over the last five years have been less than pleasing. You would have done a lot better buying an index fund, since the stock has dropped 32% in that half decade.
Although the past week has been more reassuring for shareholders, they're still in the red over the last five years, so let's see if the underlying business has been responsible for the decline.
While the efficient markets hypothesis continues to be taught by some, it has been proven that markets are over-reactive dynamic systems, and investors are not always rational. One imperfect but simple way to consider how the market perception of a company has shifted is to compare the change in the earnings per share (EPS) with the share price movement.
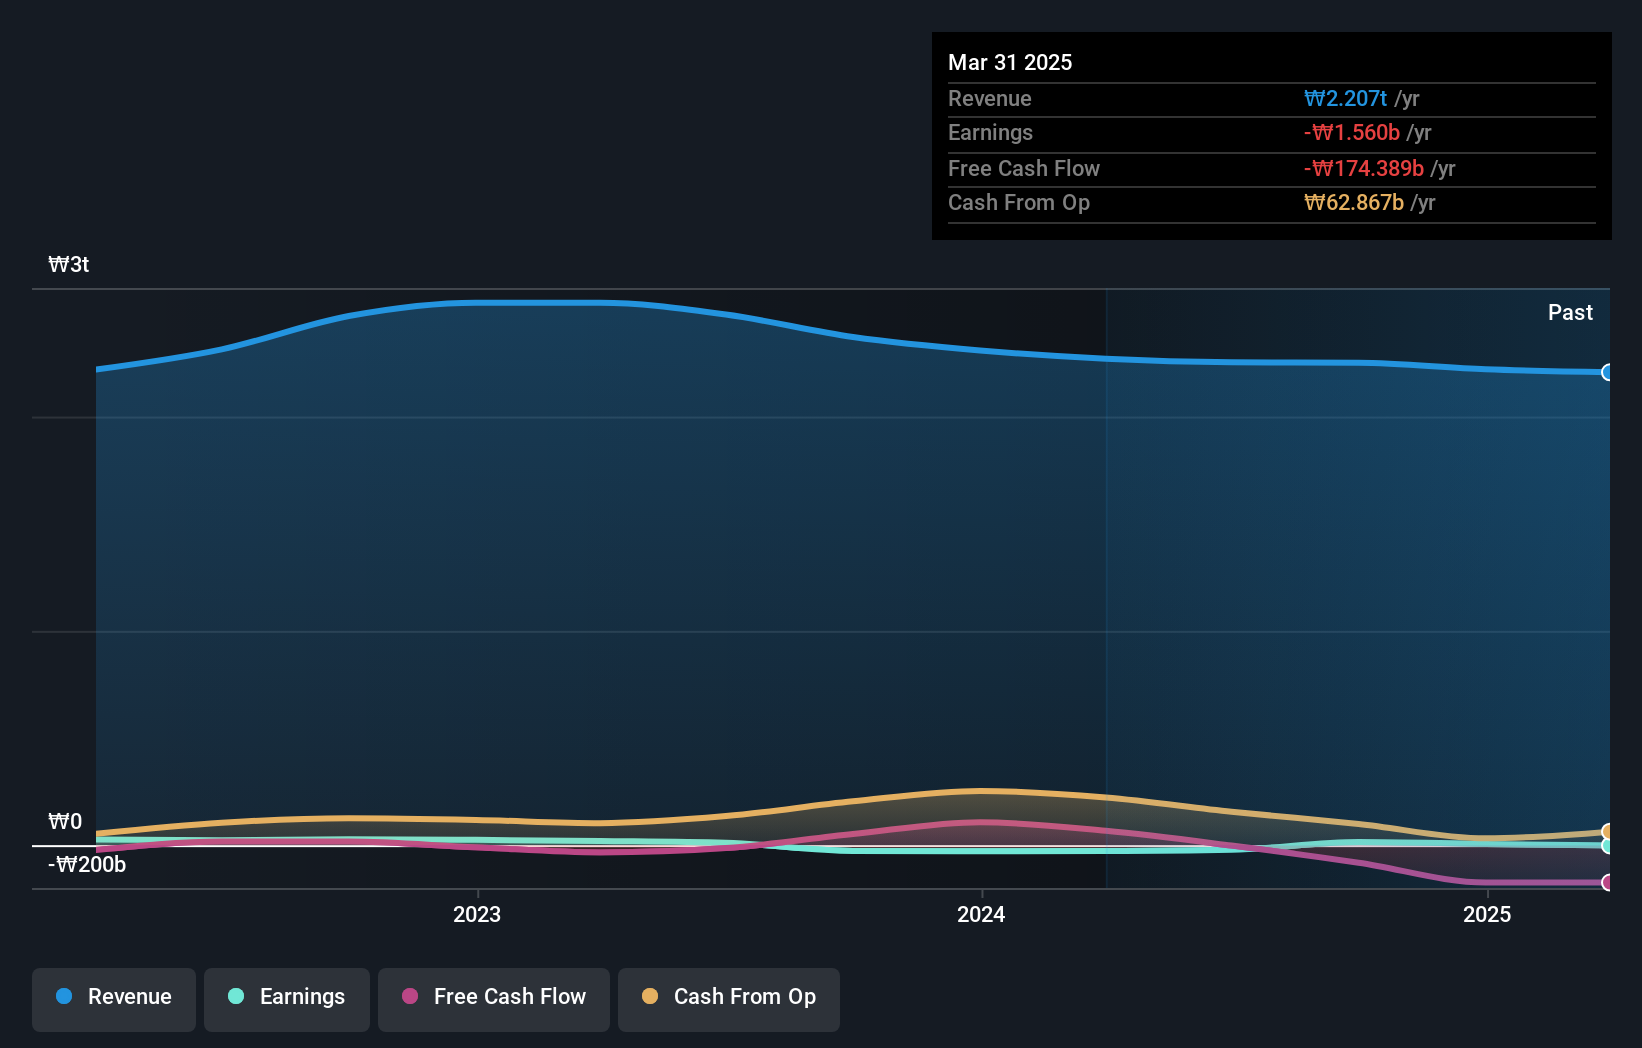
Haesung Industrial has made a profit in the past. On the other hand, it reported a trailing twelve months loss, suggesting it isn't reliably profitable. Other metrics might give us a better handle on how its value is changing over time.
In contrast to the share price, revenue has actually increased by a year in the five year period. So it seems one might have to take closer look at the fundamentals to understand why the share price languishes. After all, there may be an opportunity.
You can see how earnings and revenue have changed over time in the image below (click on the chart to see the exact values).
You can see how its balance sheet has strengthened (or weakened) over time in this free interactive graphic.
What About Dividends?
When looking at investment returns, it is important to consider the difference between total shareholder return (TSR) and share price return. Whereas the share price return only reflects the change in the share price, the TSR includes the value of dividends (assuming they were reinvested) and the benefit of any discounted capital raising or spin-off. So for companies that pay a generous dividend, the TSR is often a lot higher than the share price return. In the case of Haesung Industrial, it has a TSR of -23% for the last 5 years. That exceeds its share price return that we previously mentioned. The dividends paid by the company have thusly boosted the total shareholder return.
A Different Perspective
Haesung Industrial shareholders gained a total return of 6.8% during the year. Unfortunately this falls short of the market return. On the bright side, that's still a gain, and it is certainly better than the yearly loss of about 4% endured over half a decade. So this might be a sign the business has turned its fortunes around. It's always interesting to track share price performance over the longer term. But to understand Haesung Industrial better, we need to consider many other factors. Take risks, for example - Haesung Industrial has 3 warning signs we think you should be aware of.
If you would prefer to check out another company -- one with potentially superior financials -- then do not miss this free list of companies that have proven they can grow earnings.
Please note, the market returns quoted in this article reflect the market weighted average returns of stocks that currently trade on South Korean exchanges.
Valuation is complex, but we're here to simplify it.
Discover if Haesung Industrial might be undervalued or overvalued with our detailed analysis, featuring fair value estimates, potential risks, dividends, insider trades, and its financial condition.
Access Free AnalysisHave feedback on this article? Concerned about the content? Get in touch with us directly. Alternatively, email editorial-team (at) simplywallst.com.
This article by Simply Wall St is general in nature. We provide commentary based on historical data and analyst forecasts only using an unbiased methodology and our articles are not intended to be financial advice. It does not constitute a recommendation to buy or sell any stock, and does not take account of your objectives, or your financial situation. We aim to bring you long-term focused analysis driven by fundamental data. Note that our analysis may not factor in the latest price-sensitive company announcements or qualitative material. Simply Wall St has no position in any stocks mentioned.
About KOSDAQ:A034810
Haesung Industrial
Engages in the real estate development, rental, and management business in South Korea.
Low risk and slightly overvalued.
Market Insights

Advertisement
Community Narratives
MINISO's fair value is projected at 26.69 with an anticipated PE ratio shift of 20x
Fair Value US$24.03|11.0% undervalued
BE
Community Contributor
Procter & Gamble: A Dividend Giant Facing Slowing Growth
Fair Value US$119.81|23.3% overvalued
AN
Community Contributor
Eli Lilly's Future Growth Driven by Tirzepatide and Favorable Market Conditions
Fair Value US$1.19k|13.8% undervalued
EA
Community Contributor