
Advertisement
- South Korea
- /
- Pharma
- /
- KOSE:A000100
Yuhan Corporation (KRX:000100) Shares Could Be 20% Below Their Intrinsic Value Estimate
Key Insights
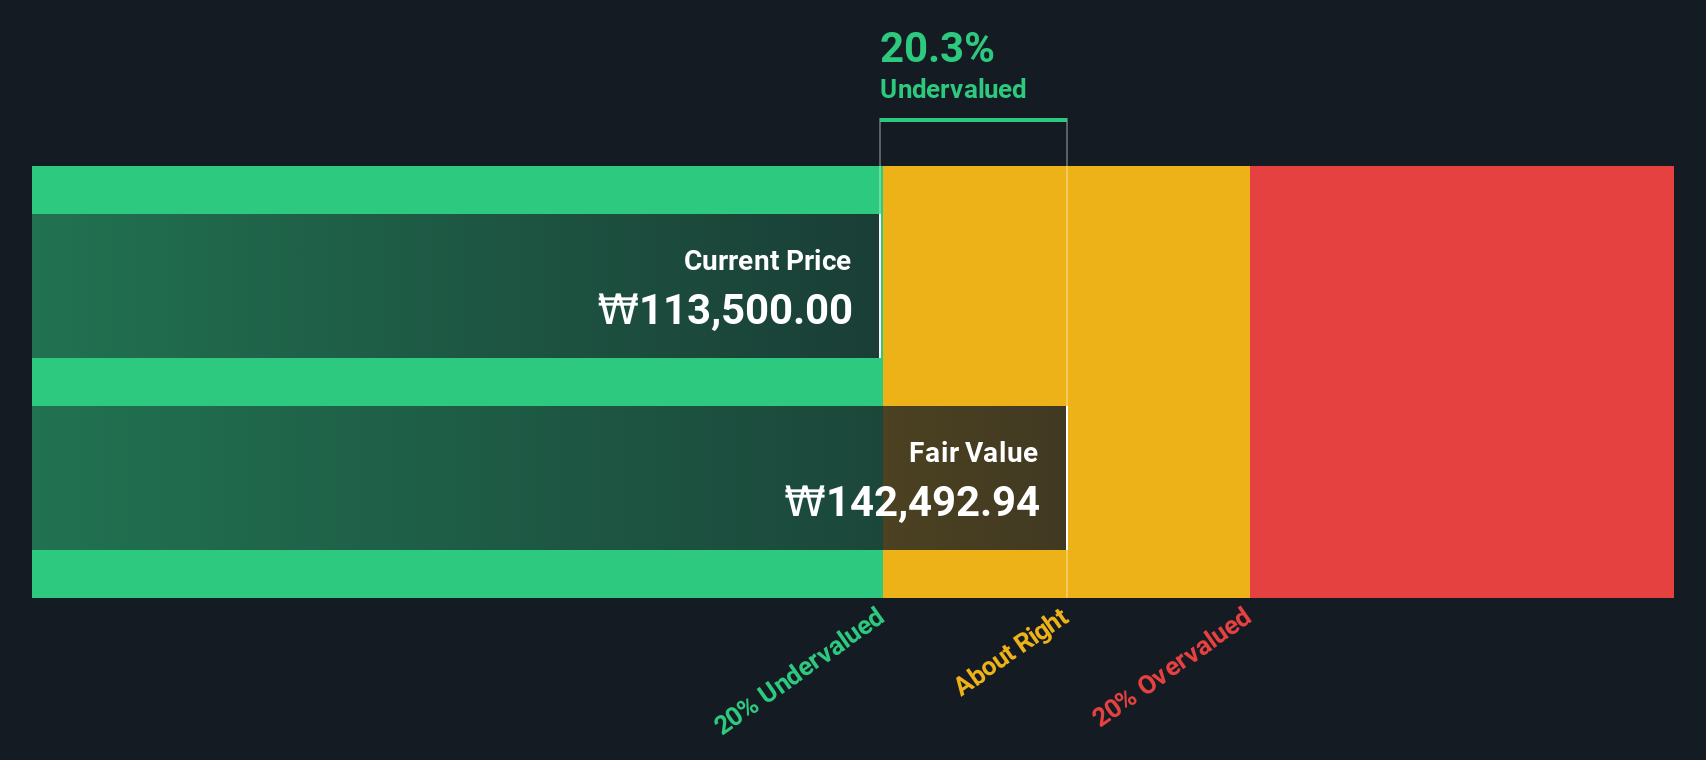
- The projected fair value for Yuhan is ₩142,493 based on 2 Stage Free Cash Flow to Equity
- Yuhan is estimated to be 20% undervalued based on current share price of ₩113,500
- The ₩145,125 analyst price target for A000100 is 1.8% more than our estimate of fair value
Today we will run through one way of estimating the intrinsic value of Yuhan Corporation (KRX:000100) by taking the expected future cash flows and discounting them to today's value. We will use the Discounted Cash Flow (DCF) model on this occasion. Models like these may appear beyond the comprehension of a lay person, but they're fairly easy to follow.
We generally believe that a company's value is the present value of all of the cash it will generate in the future. However, a DCF is just one valuation metric among many, and it is not without flaws. If you still have some burning questions about this type of valuation, take a look at the Simply Wall St analysis model.
The Method
We are going to use a two-stage DCF model, which, as the name states, takes into account two stages of growth. The first stage is generally a higher growth period which levels off heading towards the terminal value, captured in the second 'steady growth' period. In the first stage we need to estimate the cash flows to the business over the next ten years. Where possible we use analyst estimates, but when these aren't available we extrapolate the previous free cash flow (FCF) from the last estimate or reported value. We assume companies with shrinking free cash flow will slow their rate of shrinkage, and that companies with growing free cash flow will see their growth rate slow, over this period. We do this to reflect that growth tends to slow more in the early years than it does in later years.
Generally we assume that a dollar today is more valuable than a dollar in the future, so we need to discount the sum of these future cash flows to arrive at a present value estimate:
10-year free cash flow (FCF) estimate
| 2026 | 2027 | 2028 | 2029 | 2030 | 2031 | 2032 | 2033 | 2034 | 2035 | |
| Levered FCF (₩, Millions) | ₩159.5b | ₩239.1b | ₩302.7b | ₩361.6b | ₩414.1b | ₩459.7b | ₩499.1b | ₩533.3b | ₩563.6b | ₩590.8b |
| Growth Rate Estimate Source | Analyst x10 | Analyst x10 | Est @ 26.60% | Est @ 19.48% | Est @ 14.50% | Est @ 11.01% | Est @ 8.57% | Est @ 6.87% | Est @ 5.67% | Est @ 4.83% |
| Present Value (₩, Millions) Discounted @ 6.8% | ₩149.3k | ₩209.5k | ₩248.2k | ₩277.6k | ₩297.5k | ₩309.2k | ₩314.2k | ₩314.3k | ₩310.9k | ₩305.1k |
("Est" = FCF growth rate estimated by Simply Wall St)
Present Value of 10-year Cash Flow (PVCF) = ₩2.7t
We now need to calculate the Terminal Value, which accounts for all the future cash flows after this ten year period. The Gordon Growth formula is used to calculate Terminal Value at a future annual growth rate equal to the 5-year average of the 10-year government bond yield of 2.9%. We discount the terminal cash flows to today's value at a cost of equity of 6.8%.
Terminal Value (TV)= FCF2035 × (1 + g) ÷ (r – g) = ₩591b× (1 + 2.9%) ÷ (6.8%– 2.9%) = ₩15t
Present Value of Terminal Value (PVTV)= TV / (1 + r)10= ₩15t÷ ( 1 + 6.8%)10= ₩7.9t
The total value, or equity value, is then the sum of the present value of the future cash flows, which in this case is ₩11t. The last step is to then divide the equity value by the number of shares outstanding. Compared to the current share price of ₩114k, the company appears a touch undervalued at a 20% discount to where the stock price trades currently. Valuations are imprecise instruments though, rather like a telescope - move a few degrees and end up in a different galaxy. Do keep this in mind.
Important Assumptions
Now the most important inputs to a discounted cash flow are the discount rate, and of course, the actual cash flows. If you don't agree with these result, have a go at the calculation yourself and play with the assumptions. The DCF also does not consider the possible cyclicality of an industry, or a company's future capital requirements, so it does not give a full picture of a company's potential performance. Given that we are looking at Yuhan as potential shareholders, the cost of equity is used as the discount rate, rather than the cost of capital (or weighted average cost of capital, WACC) which accounts for debt. In this calculation we've used 6.8%, which is based on a levered beta of 0.800. Beta is a measure of a stock's volatility, compared to the market as a whole. We get our beta from the industry average beta of globally comparable companies, with an imposed limit between 0.8 and 2.0, which is a reasonable range for a stable business.
See our latest analysis for Yuhan
SWOT Analysis for Yuhan
Strength
- Debt is well covered by earnings.
Weakness
- Earnings declined over the past year.
- Dividend is low compared to the top 25% of dividend payers in the Pharmaceuticals market.
Opportunity
- Annual earnings are forecast to grow faster than the South Korean market.
- Trading below our estimate of fair value by more than 20%.
Threat
- Debt is not well covered by operating cash flow.
- Revenue is forecast to grow slower than 20% per year.
Moving On:
Valuation is only one side of the coin in terms of building your investment thesis, and it ideally won't be the sole piece of analysis you scrutinize for a company. It's not possible to obtain a foolproof valuation with a DCF model. Instead the best use for a DCF model is to test certain assumptions and theories to see if they would lead to the company being undervalued or overvalued. If a company grows at a different rate, or if its cost of equity or risk free rate changes sharply, the output can look very different. What is the reason for the share price sitting below the intrinsic value? For Yuhan, we've compiled three pertinent aspects you should explore:
- Risks: Be aware that Yuhan is showing 2 warning signs in our investment analysis , you should know about...
- Future Earnings: How does A000100's growth rate compare to its peers and the wider market? Dig deeper into the analyst consensus number for the upcoming years by interacting with our free analyst growth expectation chart.
- Other Solid Businesses: Low debt, high returns on equity and good past performance are fundamental to a strong business. Why not explore our interactive list of stocks with solid business fundamentals to see if there are other companies you may not have considered!
PS. The Simply Wall St app conducts a discounted cash flow valuation for every stock on the KOSE every day. If you want to find the calculation for other stocks just search here.
New: Manage All Your Stock Portfolios in One Place
We've created the ultimate portfolio companion for stock investors, and it's free.
• Connect an unlimited number of Portfolios and see your total in one currency
• Be alerted to new Warning Signs or Risks via email or mobile
• Track the Fair Value of your stocks
Have feedback on this article? Concerned about the content? Get in touch with us directly. Alternatively, email editorial-team (at) simplywallst.com.
This article by Simply Wall St is general in nature. We provide commentary based on historical data and analyst forecasts only using an unbiased methodology and our articles are not intended to be financial advice. It does not constitute a recommendation to buy or sell any stock, and does not take account of your objectives, or your financial situation. We aim to bring you long-term focused analysis driven by fundamental data. Note that our analysis may not factor in the latest price-sensitive company announcements or qualitative material. Simply Wall St has no position in any stocks mentioned.
About KOSE:A000100
Yuhan
Manufactures and sells prescription drugs, over-the-counter drugs, veterinary drugs, and household goods in South Korea and internationally.
Reasonable growth potential with adequate balance sheet.
Market Insights


Advertisement
Community Narratives
The Next Phase of Defense AI: A Robotic Response to America’s Security Gaps
Fair Value US$12.00|49.7% undervalued
MA
Community Contributor
Figma (FIG): The S&P 500’s Design Standard Turning Into an All-in-One Platform
Fair Value US$65.70|7.0% overvalued
TI
Community Contributor
Sleep Cycle's Revenue Set to Rise 10% with Strong Revenue Model
Fair Value SEK 38.04|20.3% undervalued
MA
Community Contributor
Has JB Hi-Fi Lost Its Point of Difference?
Fair Value AU$76.00|54.2% overvalued
RO
Community Contributor