
Advertisement
- South Korea
- /
- Pharma
- /
- KOSDAQ:A106190
We Think High Tech Pharm (KOSDAQ:106190) Can Stay On Top Of Its Debt
David Iben put it well when he said, 'Volatility is not a risk we care about. What we care about is avoiding the permanent loss of capital.' When we think about how risky a company is, we always like to look at its use of debt, since debt overload can lead to ruin. Importantly, High Tech Pharm Co., Ltd. (KOSDAQ:106190) does carry debt. But the real question is whether this debt is making the company risky.
What Risk Does Debt Bring?
Generally speaking, debt only becomes a real problem when a company can't easily pay it off, either by raising capital or with its own cash flow. In the worst case scenario, a company can go bankrupt if it cannot pay its creditors. However, a more usual (but still expensive) situation is where a company must dilute shareholders at a cheap share price simply to get debt under control. Having said that, the most common situation is where a company manages its debt reasonably well - and to its own advantage. The first step when considering a company's debt levels is to consider its cash and debt together.
What Is High Tech Pharm's Debt?
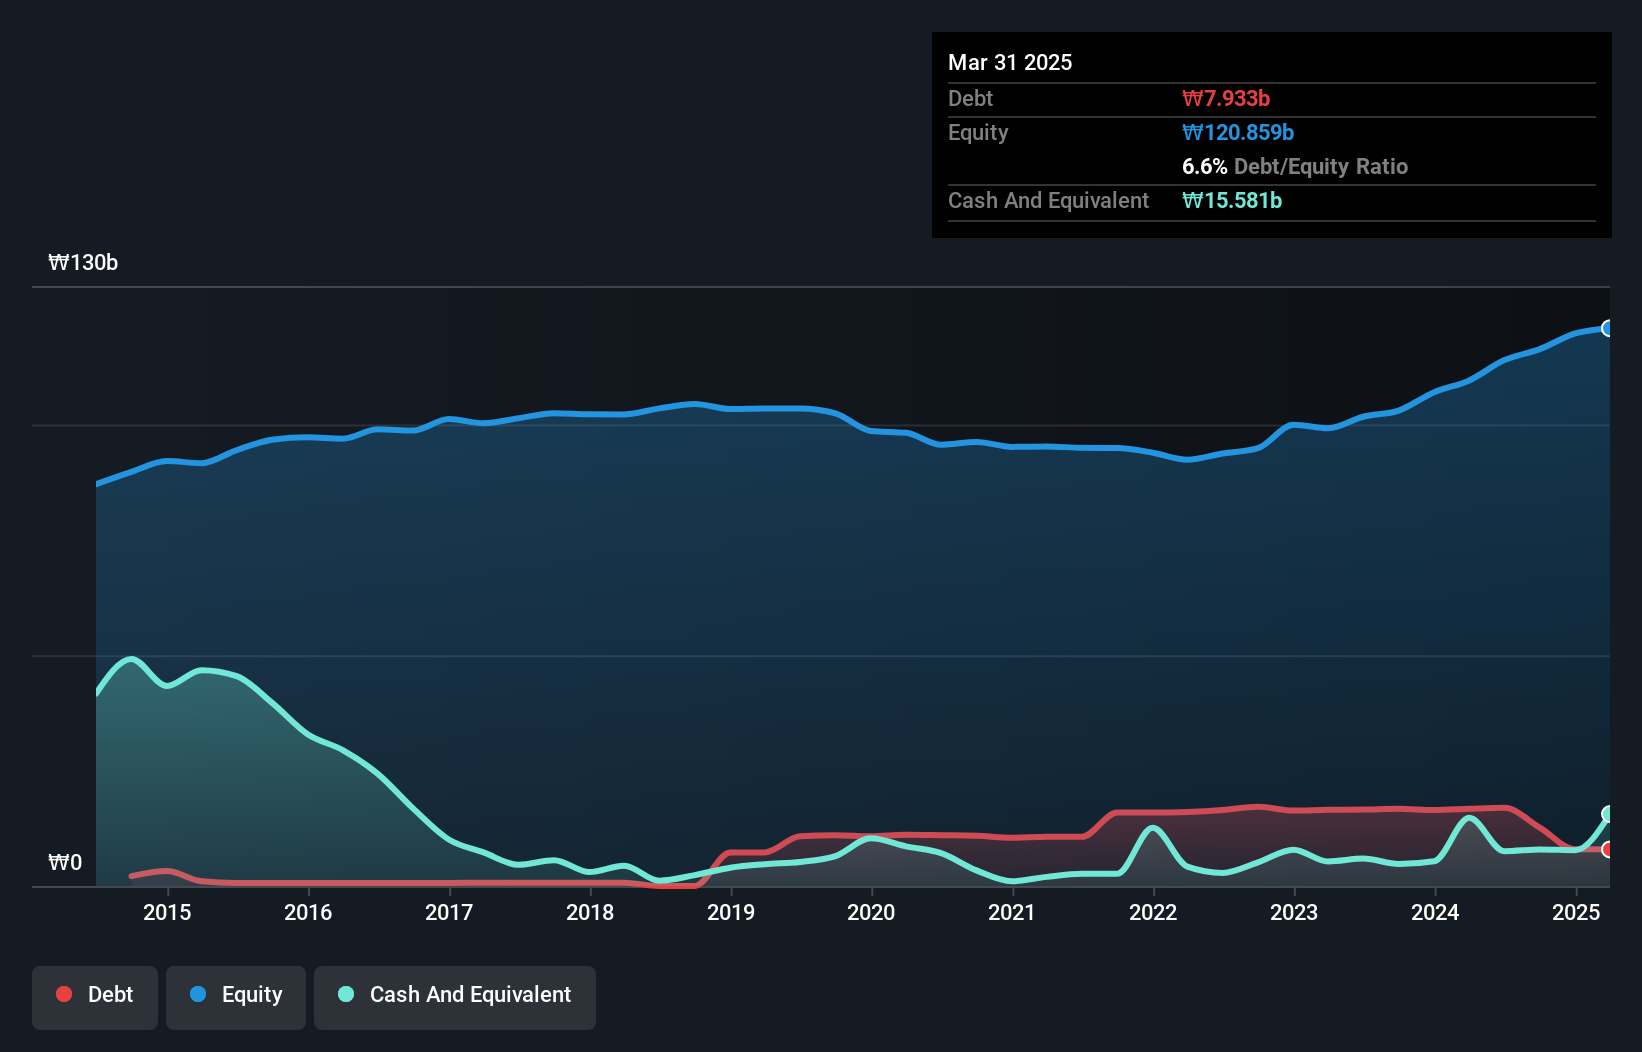
As you can see below, High Tech Pharm had ₩7.93b of debt at March 2025, down from ₩16.7b a year prior. But on the other hand it also has ₩15.6b in cash, leading to a ₩7.65b net cash position.
How Strong Is High Tech Pharm's Balance Sheet?
Zooming in on the latest balance sheet data, we can see that High Tech Pharm had liabilities of ₩18.6b due within 12 months and liabilities of ₩1.64b due beyond that. Offsetting this, it had ₩15.6b in cash and ₩14.9b in receivables that were due within 12 months. So it can boast ₩10.2b more liquid assets than total liabilities.
This short term liquidity is a sign that High Tech Pharm could probably pay off its debt with ease, as its balance sheet is far from stretched. Simply put, the fact that High Tech Pharm has more cash than debt is arguably a good indication that it can manage its debt safely.
Check out our latest analysis for High Tech Pharm
While High Tech Pharm doesn't seem to have gained much on the EBIT line, at least earnings remain stable for now. There's no doubt that we learn most about debt from the balance sheet. But you can't view debt in total isolation; since High Tech Pharm will need earnings to service that debt. So if you're keen to discover more about its earnings, it might be worth checking out this graph of its long term earnings trend.
Finally, a company can only pay off debt with cold hard cash, not accounting profits. While High Tech Pharm has net cash on its balance sheet, it's still worth taking a look at its ability to convert earnings before interest and tax (EBIT) to free cash flow, to help us understand how quickly it is building (or eroding) that cash balance. During the last three years, High Tech Pharm produced sturdy free cash flow equating to 62% of its EBIT, about what we'd expect. This free cash flow puts the company in a good position to pay down debt, when appropriate.
Summing Up
While it is always sensible to investigate a company's debt, in this case High Tech Pharm has ₩7.65b in net cash and a decent-looking balance sheet. So is High Tech Pharm's debt a risk? It doesn't seem so to us. Above most other metrics, we think its important to track how fast earnings per share is growing, if at all. If you've also come to that realization, you're in luck, because today you can view this interactive graph of High Tech Pharm's earnings per share history for free.
If you're interested in investing in businesses that can grow profits without the burden of debt, then check out this free list of growing businesses that have net cash on the balance sheet.
Valuation is complex, but we're here to simplify it.
Discover if High Tech Pharm might be undervalued or overvalued with our detailed analysis, featuring fair value estimates, potential risks, dividends, insider trades, and its financial condition.
Access Free AnalysisHave feedback on this article? Concerned about the content? Get in touch with us directly. Alternatively, email editorial-team (at) simplywallst.com.
This article by Simply Wall St is general in nature. We provide commentary based on historical data and analyst forecasts only using an unbiased methodology and our articles are not intended to be financial advice. It does not constitute a recommendation to buy or sell any stock, and does not take account of your objectives, or your financial situation. We aim to bring you long-term focused analysis driven by fundamental data. Note that our analysis may not factor in the latest price-sensitive company announcements or qualitative material. Simply Wall St has no position in any stocks mentioned.
About KOSDAQ:A106190
High Tech Pharm
Researches and develops, manufactures, and sells injectable carbapenem-based antibiotics worldwide.
Flawless balance sheet and good value.
Market Insights

Advertisement
Community Narratives
MINISO's fair value is projected at 26.69 with an anticipated PE ratio shift of 20x
Fair Value US$24.03|9.0% undervalued
BE
Community Contributor
Procter & Gamble: A Dividend Giant Facing Slowing Growth
Fair Value US$119.81|23.5% overvalued
AN
Community Contributor
Eli Lilly's Future Growth Driven by Tirzepatide and Favorable Market Conditions
Fair Value US$1.19k|14.4% undervalued
EA
Community Contributor