
Advertisement
- South Korea
- /
- Biotech
- /
- KOSDAQ:A096530
Seegene, Inc. (KOSDAQ:096530) Shares Fly 25% But Investors Aren't Buying For Growth
Seegene, Inc. (KOSDAQ:096530) shareholders have had their patience rewarded with a 25% share price jump in the last month. Looking back a bit further, it's encouraging to see the stock is up 32% in the last year.
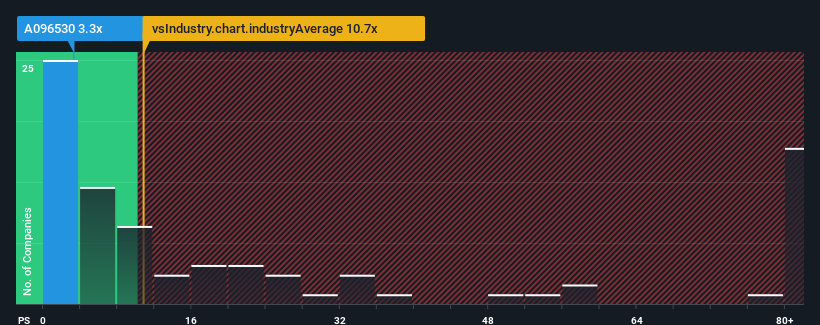
Even after such a large jump in price, Seegene's price-to-sales (or "P/S") ratio of 3.3x might still make it look like a strong buy right now compared to the wider Biotechs industry in Korea, where around half of the companies have P/S ratios above 10.7x and even P/S above 38x are quite common. However, the P/S might be quite low for a reason and it requires further investigation to determine if it's justified.
Check out our latest analysis for Seegene
How Seegene Has Been Performing
Seegene could be doing better as it's been growing revenue less than most other companies lately. It seems that many are expecting the uninspiring revenue performance to persist, which has repressed the growth of the P/S ratio. If you still like the company, you'd be hoping revenue doesn't get any worse and that you could pick up some stock while it's out of favour.
If you'd like to see what analysts are forecasting going forward, you should check out our free report on Seegene.Do Revenue Forecasts Match The Low P/S Ratio?
There's an inherent assumption that a company should far underperform the industry for P/S ratios like Seegene's to be considered reasonable.
If we review the last year of revenue growth, the company posted a worthy increase of 13%. Still, lamentably revenue has fallen 70% in aggregate from three years ago, which is disappointing. Therefore, it's fair to say the revenue growth recently has been undesirable for the company.
Looking ahead now, revenue is anticipated to climb by 18% per year during the coming three years according to the dual analysts following the company. With the industry predicted to deliver 52% growth per year, the company is positioned for a weaker revenue result.
With this information, we can see why Seegene is trading at a P/S lower than the industry. It seems most investors are expecting to see limited future growth and are only willing to pay a reduced amount for the stock.
What We Can Learn From Seegene's P/S?
Seegene's recent share price jump still sees fails to bring its P/S alongside the industry median. Using the price-to-sales ratio alone to determine if you should sell your stock isn't sensible, however it can be a practical guide to the company's future prospects.
We've established that Seegene maintains its low P/S on the weakness of its forecast growth being lower than the wider industry, as expected. Shareholders' pessimism on the revenue prospects for the company seems to be the main contributor to the depressed P/S. Unless these conditions improve, they will continue to form a barrier for the share price around these levels.
And what about other risks? Every company has them, and we've spotted 1 warning sign for Seegene you should know about.
Of course, profitable companies with a history of great earnings growth are generally safer bets. So you may wish to see this free collection of other companies that have reasonable P/E ratios and have grown earnings strongly.
New: Manage All Your Stock Portfolios in One Place
We've created the ultimate portfolio companion for stock investors, and it's free.
• Connect an unlimited number of Portfolios and see your total in one currency
• Be alerted to new Warning Signs or Risks via email or mobile
• Track the Fair Value of your stocks
Have feedback on this article? Concerned about the content? Get in touch with us directly. Alternatively, email editorial-team (at) simplywallst.com.
This article by Simply Wall St is general in nature. We provide commentary based on historical data and analyst forecasts only using an unbiased methodology and our articles are not intended to be financial advice. It does not constitute a recommendation to buy or sell any stock, and does not take account of your objectives, or your financial situation. We aim to bring you long-term focused analysis driven by fundamental data. Note that our analysis may not factor in the latest price-sensitive company announcements or qualitative material. Simply Wall St has no position in any stocks mentioned.
About KOSDAQ:A096530
Undervalued with excellent balance sheet.
Similar Companies
Market Insights

Advertisement
Community Narratives
Finding The True Value Of A Logistics Powerhouse
Fair Value US$95.21|8.4% undervalued
NV
Community Contributor
Paradigm Biopharmaceuticals Will Lead Osteoarthritis Treatment with Zilosul's FDA Success
Fair Value AU$5.50|91.9% undervalued
AM
Community Contributor
Barrick Mining (ABX:CA): A Gold Hedge against a U.S. Shutdown
Fair Value CA$60.00|24.2% undervalued
GM
Community Contributor