
Advertisement
- South Korea
- /
- Biotech
- /
- KOSDAQ:A096530
Seegene, Inc. (KOSDAQ:096530) Is Going Strong But Fundamentals Appear To Be Mixed : Is There A Clear Direction For The Stock?
Most readers would already be aware that Seegene's (KOSDAQ:096530) stock increased significantly by 44% over the past three months. But the company's key financial indicators appear to be differing across the board and that makes us question whether or not the company's current share price momentum can be maintained. Particularly, we will be paying attention to Seegene's ROE today.
Return on equity or ROE is a key measure used to assess how efficiently a company's management is utilizing the company's capital. In short, ROE shows the profit each dollar generates with respect to its shareholder investments.
How Do You Calculate Return On Equity?
The formula for ROE is:
Return on Equity = Net Profit (from continuing operations) ÷ Shareholders' Equity
So, based on the above formula, the ROE for Seegene is:
1.1% = ₩11b ÷ ₩1.0t (Based on the trailing twelve months to March 2025).
The 'return' is the income the business earned over the last year. Another way to think of that is that for every ₩1 worth of equity, the company was able to earn ₩0.01 in profit.
Check out our latest analysis for Seegene
Why Is ROE Important For Earnings Growth?
We have already established that ROE serves as an efficient profit-generating gauge for a company's future earnings. Based on how much of its profits the company chooses to reinvest or "retain", we are then able to evaluate a company's future ability to generate profits. Generally speaking, other things being equal, firms with a high return on equity and profit retention, have a higher growth rate than firms that don’t share these attributes.
Seegene's Earnings Growth And 1.1% ROE
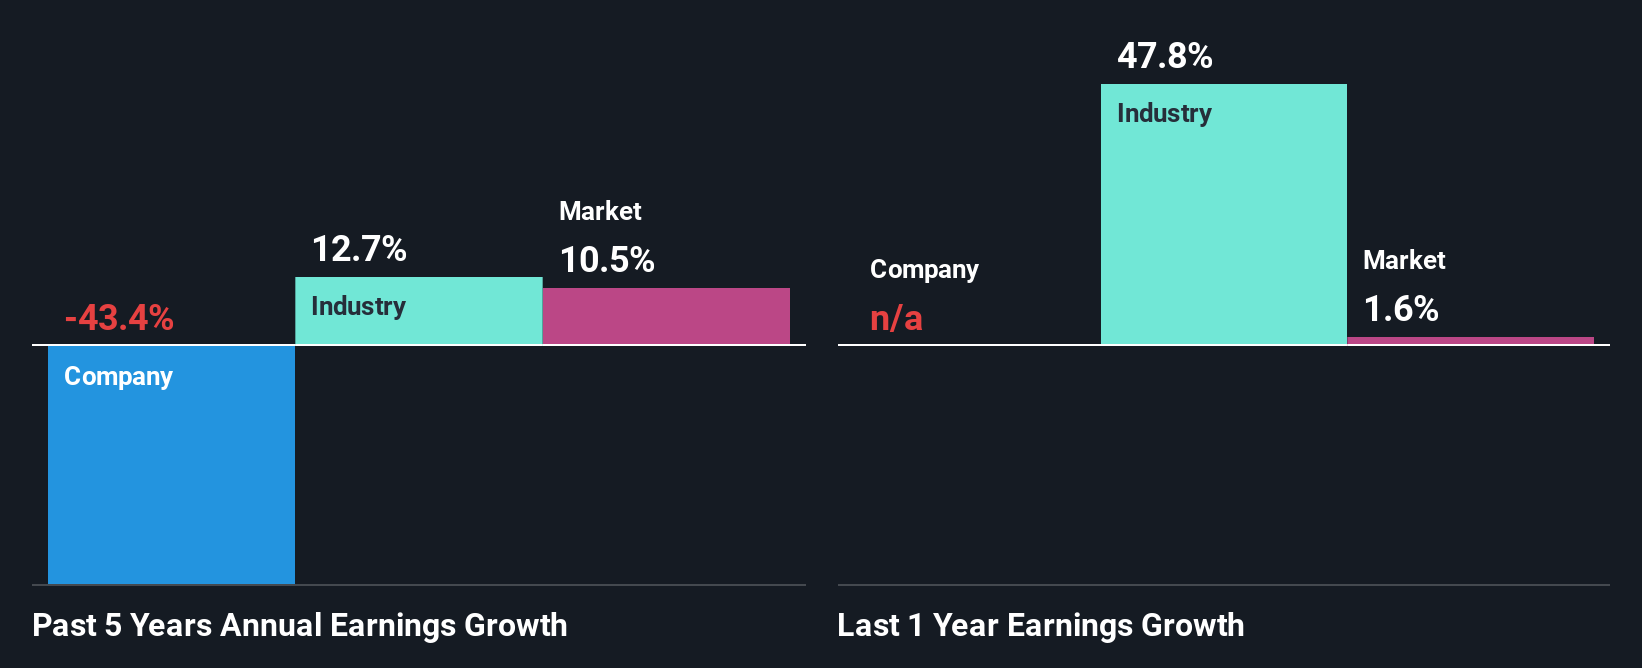
As you can see, Seegene's ROE looks pretty weak. Even when compared to the industry average of 6.6%, the ROE figure is pretty disappointing. Given the circumstances, the significant decline in net income by 43% seen by Seegene over the last five years is not surprising. We believe that there also might be other aspects that are negatively influencing the company's earnings prospects. Such as - low earnings retention or poor allocation of capital.
That being said, we compared Seegene's performance with the industry and were concerned when we found that while the company has shrunk its earnings, the industry has grown its earnings at a rate of 13% in the same 5-year period.
Earnings growth is an important metric to consider when valuing a stock. It’s important for an investor to know whether the market has priced in the company's expected earnings growth (or decline). This then helps them determine if the stock is placed for a bright or bleak future. One good indicator of expected earnings growth is the P/E ratio which determines the price the market is willing to pay for a stock based on its earnings prospects. So, you may want to check if Seegene is trading on a high P/E or a low P/E, relative to its industry.
Is Seegene Efficiently Re-investing Its Profits?
Seegene's low three-year median payout ratio of 15% (or a retention ratio of 85%) over the last three years should mean that the company is retaining most of its earnings to fuel its growth but the company's earnings have actually shrunk. This typically shouldn't be the case when a company is retaining most of its earnings. So there might be other factors at play here which could potentially be hampering growth. For instance, the business has faced some headwinds.
Additionally, Seegene has paid dividends over a period of five years, which means that the company's management is rather focused on keeping up its dividend payments, regardless of the shrinking earnings. Our latest analyst data shows that the future payout ratio of the company is expected to rise to 49% over the next three years. Regardless, the future ROE for Seegene is speculated to rise to 11% despite the anticipated increase in the payout ratio. There could probably be other factors that could be driving the future growth in the ROE.
Conclusion
In total, we're a bit ambivalent about Seegene's performance. While the company does have a high rate of profit retention, its low rate of return is probably hampering its earnings growth. With that said, we studied the latest analyst forecasts and found that while the company has shrunk its earnings in the past, analysts expect its earnings to grow in the future. To know more about the company's future earnings growth forecasts take a look at this free report on analyst forecasts for the company to find out more.
New: Manage All Your Stock Portfolios in One Place
We've created the ultimate portfolio companion for stock investors, and it's free.
• Connect an unlimited number of Portfolios and see your total in one currency
• Be alerted to new Warning Signs or Risks via email or mobile
• Track the Fair Value of your stocks
Have feedback on this article? Concerned about the content? Get in touch with us directly. Alternatively, email editorial-team (at) simplywallst.com.
This article by Simply Wall St is general in nature. We provide commentary based on historical data and analyst forecasts only using an unbiased methodology and our articles are not intended to be financial advice. It does not constitute a recommendation to buy or sell any stock, and does not take account of your objectives, or your financial situation. We aim to bring you long-term focused analysis driven by fundamental data. Note that our analysis may not factor in the latest price-sensitive company announcements or qualitative material. Simply Wall St has no position in any stocks mentioned.
About KOSDAQ:A096530
Undervalued with excellent balance sheet.
Similar Companies
Market Insights

Advertisement
Community Narratives
MINISO's fair value is projected at 26.69 with an anticipated PE ratio shift of 20x
Fair Value US$24.03|9.0% undervalued
BE
Community Contributor
Procter & Gamble: A Dividend Giant Facing Slowing Growth
Fair Value US$119.81|23.5% overvalued
AN
Community Contributor
Eli Lilly's Future Growth Driven by Tirzepatide and Favorable Market Conditions
Fair Value US$1.19k|14.4% undervalued
EA
Community Contributor