
Advertisement
- South Korea
- /
- Media
- /
- KOSDAQ:A207760
What You Can Learn From Mr. Blue Corporation's (KOSDAQ:207760) P/S After Its 27% Share Price Crash

Mr. Blue Corporation (KOSDAQ:207760) shares have had a horrible month, losing 27% after a relatively good period beforehand. The drop over the last 30 days has capped off a tough year for shareholders, with the share price down 45% in that time.
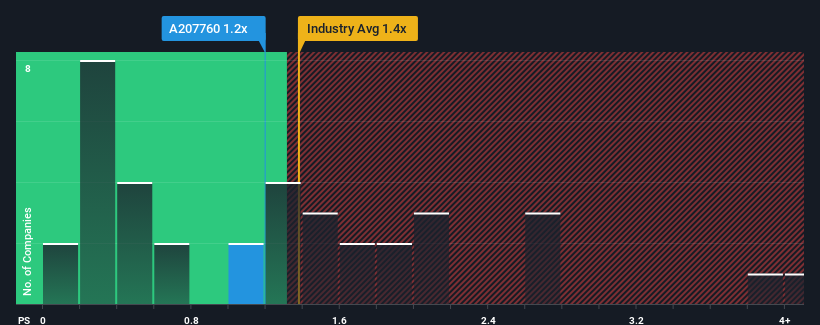
Even after such a large drop in price, you could still be forgiven for feeling indifferent about Mr. Blue's P/S ratio of 1.2x, since the median price-to-sales (or "P/S") ratio for the Media industry in Korea is also close to 1.4x. However, investors might be overlooking a clear opportunity or potential setback if there is no rational basis for the P/S.
View our latest analysis for Mr. Blue
What Does Mr. Blue's Recent Performance Look Like?
For instance, Mr. Blue's receding revenue in recent times would have to be some food for thought. Perhaps investors believe the recent revenue performance is enough to keep in line with the industry, which is keeping the P/S from dropping off. If you like the company, you'd at least be hoping this is the case so that you could potentially pick up some stock while it's not quite in favour.
Want the full picture on earnings, revenue and cash flow for the company? Then our free report on Mr. Blue will help you shine a light on its historical performance.Do Revenue Forecasts Match The P/S Ratio?
Mr. Blue's P/S ratio would be typical for a company that's only expected to deliver moderate growth, and importantly, perform in line with the industry.
Retrospectively, the last year delivered a frustrating 11% decrease to the company's top line. At least revenue has managed not to go completely backwards from three years ago in aggregate, thanks to the earlier period of growth. So it appears to us that the company has had a mixed result in terms of growing revenue over that time.
It's interesting to note that the rest of the industry is similarly expected to grow by 2.7% over the next year, which is fairly even with the company's recent medium-term annualised growth rates.
With this information, we can see why Mr. Blue is trading at a fairly similar P/S to the industry. It seems most investors are expecting to see average growth rates continue into the future and are only willing to pay a moderate amount for the stock.
The Bottom Line On Mr. Blue's P/S
Mr. Blue's plummeting stock price has brought its P/S back to a similar region as the rest of the industry. Typically, we'd caution against reading too much into price-to-sales ratios when settling on investment decisions, though it can reveal plenty about what other market participants think about the company.
As we've seen, Mr. Blue's three-year revenue trends seem to be contributing to its P/S, given they look similar to current industry expectations. Currently, with a past revenue trend that aligns closely wit the industry outlook, shareholders are confident the company's future revenue outlook won't contain any major surprises. If recent medium-term revenue trends continue, it's hard to see the share price moving strongly in either direction in the near future under these circumstances.
And what about other risks? Every company has them, and we've spotted 3 warning signs for Mr. Blue (of which 1 can't be ignored!) you should know about.
If these risks are making you reconsider your opinion on Mr. Blue, explore our interactive list of high quality stocks to get an idea of what else is out there.
New: Manage All Your Stock Portfolios in One Place
We've created the ultimate portfolio companion for stock investors, and it's free.
• Connect an unlimited number of Portfolios and see your total in one currency
• Be alerted to new Warning Signs or Risks via email or mobile
• Track the Fair Value of your stocks
Have feedback on this article? Concerned about the content? Get in touch with us directly. Alternatively, email editorial-team (at) simplywallst.com.
This article by Simply Wall St is general in nature. We provide commentary based on historical data and analyst forecasts only using an unbiased methodology and our articles are not intended to be financial advice. It does not constitute a recommendation to buy or sell any stock, and does not take account of your objectives, or your financial situation. We aim to bring you long-term focused analysis driven by fundamental data. Note that our analysis may not factor in the latest price-sensitive company announcements or qualitative material. Simply Wall St has no position in any stocks mentioned.
About KOSDAQ:A207760
Mr. Blue
Operates as an entertainment company in South Korea and internationally.
Adequate balance sheet low.
Market Insights


Advertisement
Community Narratives
Alphabet: The Under-appreciated Compounder Hiding in Plain Sight
Fair Value US$282.83|31.8% undervalued
BL
Community Contributor
Planet Labs: At The Heart Of The Emerging New Space Boom
Fair Value US$11.31|44.7% undervalued
AN
Community Contributor
Exxon in Guyana 5 year forecast Low $135 to High $189
Fair Value US$174.00|35.8% undervalued
AG
Community Contributor