
Advertisement
The external fund manager backed by Berkshire Hathaway's Charlie Munger, Li Lu, makes no bones about it when he says 'The biggest investment risk is not the volatility of prices, but whether you will suffer a permanent loss of capital.' So it might be obvious that you need to consider debt, when you think about how risky any given stock is, because too much debt can sink a company. Importantly, The E&M Co., Ltd. (KOSDAQ:089230) does carry debt. But the real question is whether this debt is making the company risky.
When Is Debt Dangerous?
Generally speaking, debt only becomes a real problem when a company can't easily pay it off, either by raising capital or with its own cash flow. Ultimately, if the company can't fulfill its legal obligations to repay debt, shareholders could walk away with nothing. However, a more common (but still painful) scenario is that it has to raise new equity capital at a low price, thus permanently diluting shareholders. Of course, plenty of companies use debt to fund growth, without any negative consequences. The first thing to do when considering how much debt a business uses is to look at its cash and debt together.
How Much Debt Does E&M Carry?
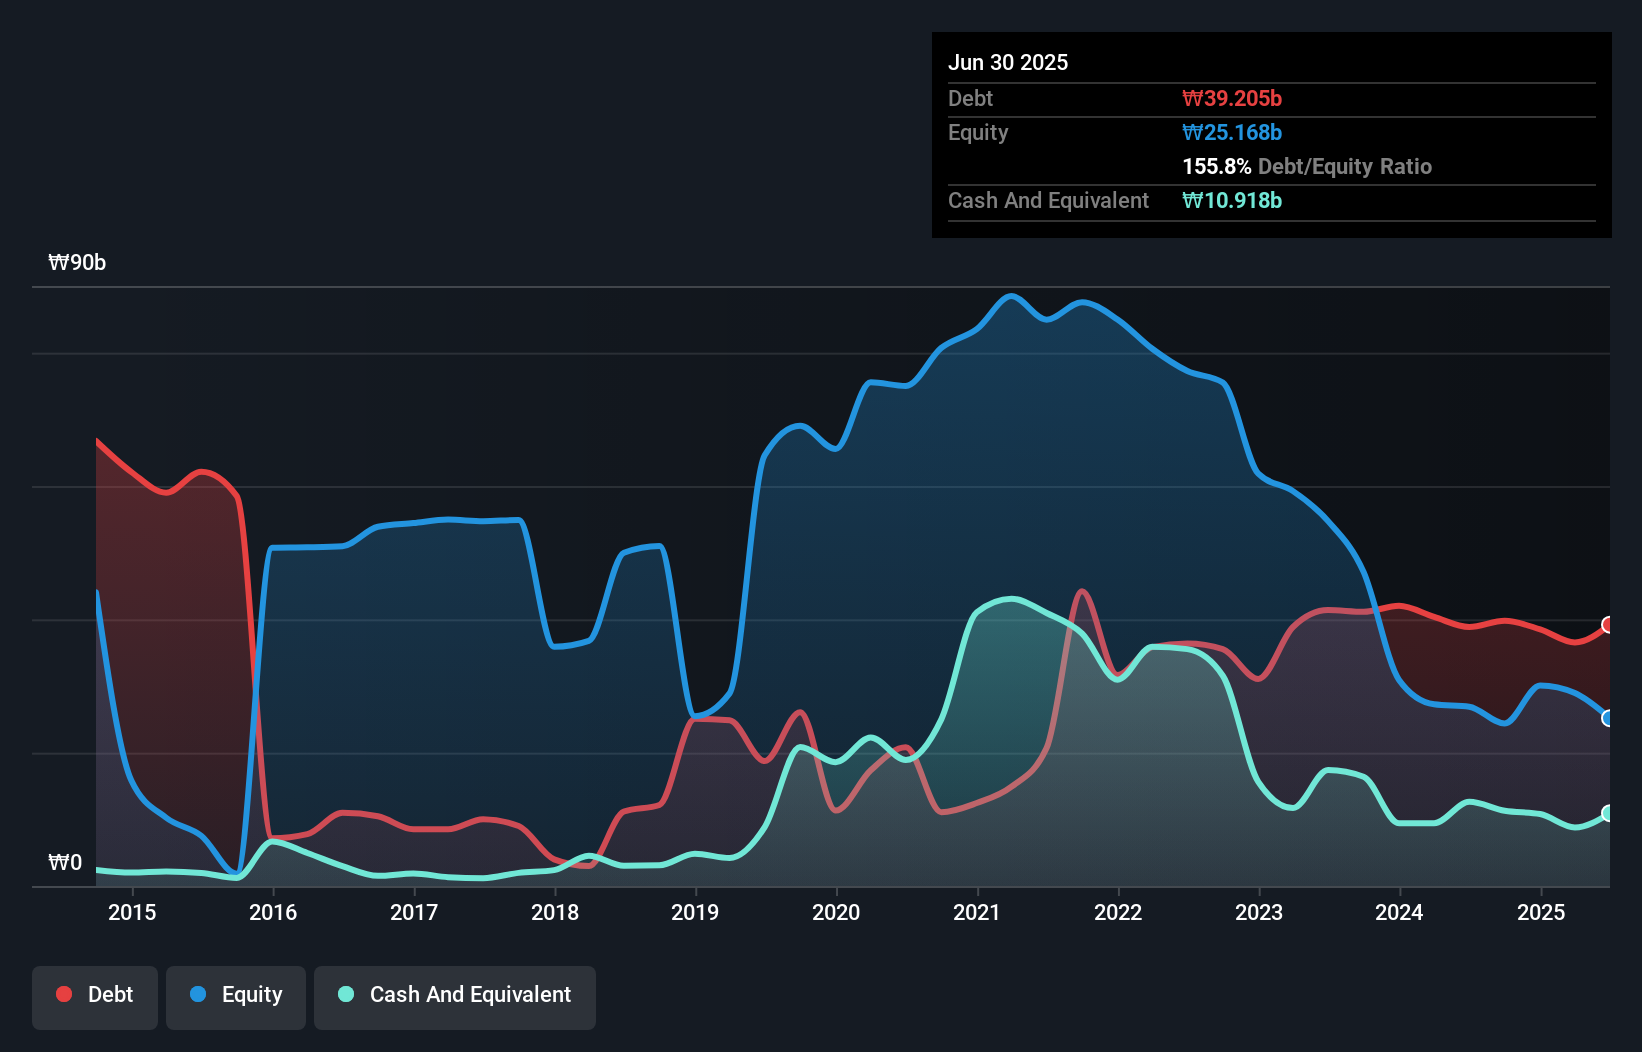
As you can see below, E&M had ₩39.2b of debt, at June 2025, which is about the same as the year before. You can click the chart for greater detail. However, it does have ₩10.9b in cash offsetting this, leading to net debt of about ₩28.3b.
How Healthy Is E&M's Balance Sheet?
Zooming in on the latest balance sheet data, we can see that E&M had liabilities of ₩50.4b due within 12 months and liabilities of ₩336.1m due beyond that. Offsetting this, it had ₩10.9b in cash and ₩5.83b in receivables that were due within 12 months. So its liabilities total ₩34.0b more than the combination of its cash and short-term receivables.
When you consider that this deficiency exceeds the company's ₩24.6b market capitalization, you might well be inclined to review the balance sheet intently. Hypothetically, extremely heavy dilution would be required if the company were forced to pay down its liabilities by raising capital at the current share price. The balance sheet is clearly the area to focus on when you are analysing debt. But it is E&M's earnings that will influence how the balance sheet holds up in the future. So if you're keen to discover more about its earnings, it might be worth checking out this graph of its long term earnings trend.
See our latest analysis for E&M
In the last year E&M had a loss before interest and tax, and actually shrunk its revenue by 30%, to ₩19b. To be frank that doesn't bode well.
Caveat Emptor
While E&M's falling revenue is about as heartwarming as a wet blanket, arguably its earnings before interest and tax (EBIT) loss is even less appealing. Its EBIT loss was a whopping ₩7.8b. When we look at that alongside the significant liabilities, we're not particularly confident about the company. It would need to improve its operations quickly for us to be interested in it. Not least because it burned through ₩5.9b in negative free cash flow over the last year. So suffice it to say we consider the stock to be risky. There's no doubt that we learn most about debt from the balance sheet. However, not all investment risk resides within the balance sheet - far from it. Case in point: We've spotted 3 warning signs for E&M you should be aware of, and 2 of them are concerning.
When all is said and done, sometimes its easier to focus on companies that don't even need debt. Readers can access a list of growth stocks with zero net debt 100% free, right now.
Valuation is complex, but we're here to simplify it.
Discover if E&M might be undervalued or overvalued with our detailed analysis, featuring fair value estimates, potential risks, dividends, insider trades, and its financial condition.
Access Free AnalysisHave feedback on this article? Concerned about the content? Get in touch with us directly. Alternatively, email editorial-team (at) simplywallst.com.
This article by Simply Wall St is general in nature. We provide commentary based on historical data and analyst forecasts only using an unbiased methodology and our articles are not intended to be financial advice. It does not constitute a recommendation to buy or sell any stock, and does not take account of your objectives, or your financial situation. We aim to bring you long-term focused analysis driven by fundamental data. Note that our analysis may not factor in the latest price-sensitive company announcements or qualitative material. Simply Wall St has no position in any stocks mentioned.
About KOSDAQ:A089230
E&M
Develops and operates platforms based on live streaming technology in South Korea.
Mediocre balance sheet and slightly overvalued.
Market Insights

Advertisement
Community Narratives
The company that turned a verb into a global necessity and basically runs the modern internet, digital ads, smartphones, maps, and AI.
Fair Value US$300.00|10.8% undervalued
OS
Community Contributor
Flowers Foods Pays A Fair Price For Health
Fair Value US$16.12|22.0% undervalued
NV
Community Contributor
TMX Group will thrive with 33.3% profit margin and enduring market moat
Fair Value CA$49.90|3.8% overvalued
LI
Community Contributor