
Advertisement
- South Korea
- /
- Chemicals
- /
- KOSE:A011500
Here's Why Hannong Chemicals (KRX:011500) Can Manage Its Debt Responsibly
Legendary fund manager Li Lu (who Charlie Munger backed) once said, 'The biggest investment risk is not the volatility of prices, but whether you will suffer a permanent loss of capital.' When we think about how risky a company is, we always like to look at its use of debt, since debt overload can lead to ruin. Importantly, Hannong Chemicals Inc. (KRX:011500) does carry debt. But the more important question is: how much risk is that debt creating?
When Is Debt Dangerous?
Generally speaking, debt only becomes a real problem when a company can't easily pay it off, either by raising capital or with its own cash flow. Ultimately, if the company can't fulfill its legal obligations to repay debt, shareholders could walk away with nothing. However, a more frequent (but still costly) occurrence is where a company must issue shares at bargain-basement prices, permanently diluting shareholders, just to shore up its balance sheet. Of course, plenty of companies use debt to fund growth, without any negative consequences. When we think about a company's use of debt, we first look at cash and debt together.
Check out our latest analysis for Hannong Chemicals
How Much Debt Does Hannong Chemicals Carry?
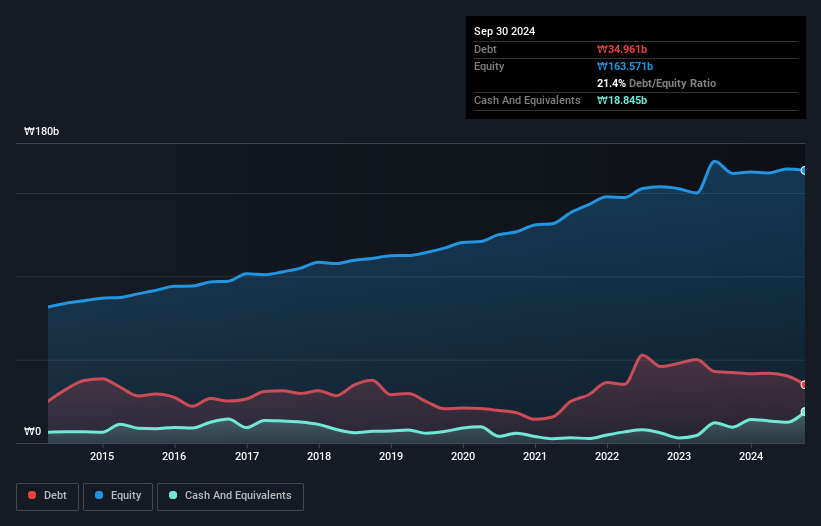
You can click the graphic below for the historical numbers, but it shows that Hannong Chemicals had ₩35.0b of debt in September 2024, down from ₩42.3b, one year before. However, it also had ₩18.8b in cash, and so its net debt is ₩16.1b.
A Look At Hannong Chemicals' Liabilities
Zooming in on the latest balance sheet data, we can see that Hannong Chemicals had liabilities of ₩30.7b due within 12 months and liabilities of ₩37.7b due beyond that. On the other hand, it had cash of ₩18.8b and ₩55.2b worth of receivables due within a year. So it can boast ₩5.58b more liquid assets than total liabilities.
This short term liquidity is a sign that Hannong Chemicals could probably pay off its debt with ease, as its balance sheet is far from stretched.
We measure a company's debt load relative to its earnings power by looking at its net debt divided by its earnings before interest, tax, depreciation, and amortization (EBITDA) and by calculating how easily its earnings before interest and tax (EBIT) cover its interest expense (interest cover). This way, we consider both the absolute quantum of the debt, as well as the interest rates paid on it.
While Hannong Chemicals's low debt to EBITDA ratio of 1.2 suggests only modest use of debt, the fact that EBIT only covered the interest expense by 4.1 times last year does give us pause. So we'd recommend keeping a close eye on the impact financing costs are having on the business. We also note that Hannong Chemicals improved its EBIT from a last year's loss to a positive ₩5.2b. The balance sheet is clearly the area to focus on when you are analysing debt. But it is Hannong Chemicals's earnings that will influence how the balance sheet holds up in the future. So if you're keen to discover more about its earnings, it might be worth checking out this graph of its long term earnings trend.
Finally, a company can only pay off debt with cold hard cash, not accounting profits. So it is important to check how much of its earnings before interest and tax (EBIT) converts to actual free cash flow. Over the last year, Hannong Chemicals actually produced more free cash flow than EBIT. There's nothing better than incoming cash when it comes to staying in your lenders' good graces.
Our View
Hannong Chemicals's conversion of EBIT to free cash flow suggests it can handle its debt as easily as Cristiano Ronaldo could score a goal against an under 14's goalkeeper. But, on a more sombre note, we are a little concerned by its interest cover. Taking all this data into account, it seems to us that Hannong Chemicals takes a pretty sensible approach to debt. While that brings some risk, it can also enhance returns for shareholders. The balance sheet is clearly the area to focus on when you are analysing debt. However, not all investment risk resides within the balance sheet - far from it. These risks can be hard to spot. Every company has them, and we've spotted 2 warning signs for Hannong Chemicals (of which 1 shouldn't be ignored!) you should know about.
At the end of the day, it's often better to focus on companies that are free from net debt. You can access our special list of such companies (all with a track record of profit growth). It's free.
Valuation is complex, but we're here to simplify it.
Discover if Hannong Chemicals might be undervalued or overvalued with our detailed analysis, featuring fair value estimates, potential risks, dividends, insider trades, and its financial condition.
Access Free AnalysisHave feedback on this article? Concerned about the content? Get in touch with us directly. Alternatively, email editorial-team (at) simplywallst.com.
This article by Simply Wall St is general in nature. We provide commentary based on historical data and analyst forecasts only using an unbiased methodology and our articles are not intended to be financial advice. It does not constitute a recommendation to buy or sell any stock, and does not take account of your objectives, or your financial situation. We aim to bring you long-term focused analysis driven by fundamental data. Note that our analysis may not factor in the latest price-sensitive company announcements or qualitative material. Simply Wall St has no position in any stocks mentioned.
About KOSE:A011500
Hannong Chemicals
Produces and sells chemical raw materials in South Korea.
Excellent balance sheet with acceptable track record.
Market Insights

Advertisement
Community Narratives
MicroVision will explode future revenue by 380.37% with a vision towards success
Fair Value US$60|98.4% undervalued
TH
Community Contributor
The Indispensable Artery for a New North American Economy
Fair Value CA$132.87|0.7% overvalued
TI
Community Contributor
Recently Updated Narratives
CE

cementafriend on Constellation Energy ·
Constellation Energy Dividends and Growth
Fair Value:US$348.054.7% overvalued
2 followersusers have followed this narrative
0 commentsusers have commented on this narrative
0 likesusers have liked this narrative
KH

Khagani on CoreWeave ·
CoreWeave's Revenue Expected to Rocket 77.88% in 5-Year Forecast
Fair Value:US$11033.5% undervalued
1 followerusers have followed this narrative
0 commentsusers have commented on this narrative
0 likesusers have liked this narrative
PO

PortfolioPlus on Bisalloy Steel Group ·
Bisalloy Steel Group will shine with a projected profit margin increase of 12.8%
Fair Value:AU$6.7118.0% undervalued
2 followersusers have followed this narrative
0 commentsusers have commented on this narrative
0 likesusers have liked this narrative
Popular Narratives
TH

TheWallstreetKing on MicroVision ·
MicroVision will explode future revenue by 380.37% with a vision towards success
Fair Value:US$6098.4% undervalued
101 followersusers have followed this narrative
10 commentsusers have commented on this narrative
20 likesusers have liked this narrative
AN


AnalystConsensusTarget on NVIDIA ·
NVDA: Expanding AI Demand Will Drive Major Data Center Investments Through 2026
Fair Value:US$250.3929.3% undervalued
935 followersusers have followed this narrative
6 commentsusers have commented on this narrative
23 likesusers have liked this narrative
OS


oscargarcia on Alphabet ·
The company that turned a verb into a global necessity and basically runs the modern internet, digital ads, smartphones, maps, and AI.
Fair Value:US$3405.8% undervalued
140 followersusers have followed this narrative
6 commentsusers have commented on this narrative
18 likesusers have liked this narrative