
Advertisement
Some say volatility, rather than debt, is the best way to think about risk as an investor, but Warren Buffett famously said that 'Volatility is far from synonymous with risk.' When we think about how risky a company is, we always like to look at its use of debt, since debt overload can lead to ruin. We can see that KCC Corporation (KRX:002380) does use debt in its business. But the more important question is: how much risk is that debt creating?
Why Does Debt Bring Risk?
Debt assists a business until the business has trouble paying it off, either with new capital or with free cash flow. If things get really bad, the lenders can take control of the business. However, a more usual (but still expensive) situation is where a company must dilute shareholders at a cheap share price simply to get debt under control. Of course, plenty of companies use debt to fund growth, without any negative consequences. When we examine debt levels, we first consider both cash and debt levels, together.
View our latest analysis for KCC
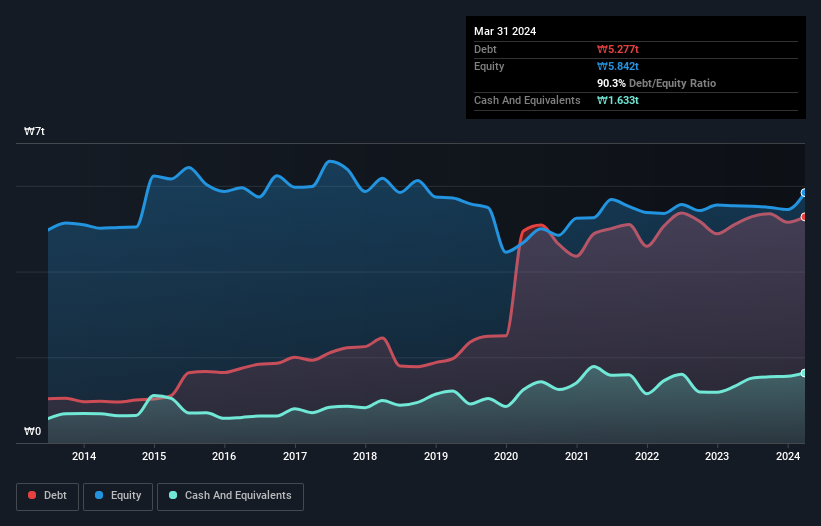
What Is KCC's Net Debt?
The chart below, which you can click on for greater detail, shows that KCC had ₩5.28t in debt in March 2024; about the same as the year before. However, it does have ₩1.63t in cash offsetting this, leading to net debt of about ₩3.64t.
How Healthy Is KCC's Balance Sheet?
According to the last reported balance sheet, KCC had liabilities of ₩3.51t due within 12 months, and liabilities of ₩4.75t due beyond 12 months. Offsetting these obligations, it had cash of ₩1.63t as well as receivables valued at ₩1.25t due within 12 months. So it has liabilities totalling ₩5.37t more than its cash and near-term receivables, combined.
The deficiency here weighs heavily on the ₩2.26t company itself, as if a child were struggling under the weight of an enormous back-pack full of books, his sports gear, and a trumpet. So we definitely think shareholders need to watch this one closely. After all, KCC would likely require a major re-capitalisation if it had to pay its creditors today.
We use two main ratios to inform us about debt levels relative to earnings. The first is net debt divided by earnings before interest, tax, depreciation, and amortization (EBITDA), while the second is how many times its earnings before interest and tax (EBIT) covers its interest expense (or its interest cover, for short). This way, we consider both the absolute quantum of the debt, as well as the interest rates paid on it.
While we wouldn't worry about KCC's net debt to EBITDA ratio of 4.6, we think its super-low interest cover of 1.9 times is a sign of high leverage. It seems that the business incurs large depreciation and amortisation charges, so maybe its debt load is heavier than it would first appear, since EBITDA is arguably a generous measure of earnings. So shareholders should probably be aware that interest expenses appear to have really impacted the business lately. Investors should also be troubled by the fact that KCC saw its EBIT drop by 13% over the last twelve months. If things keep going like that, handling the debt will about as easy as bundling an angry house cat into its travel box. When analysing debt levels, the balance sheet is the obvious place to start. But it is future earnings, more than anything, that will determine KCC's ability to maintain a healthy balance sheet going forward. So if you're focused on the future you can check out this free report showing analyst profit forecasts.
Finally, a business needs free cash flow to pay off debt; accounting profits just don't cut it. So the logical step is to look at the proportion of that EBIT that is matched by actual free cash flow. During the last three years, KCC produced sturdy free cash flow equating to 54% of its EBIT, about what we'd expect. This cold hard cash means it can reduce its debt when it wants to.
Our View
To be frank both KCC's interest cover and its track record of staying on top of its total liabilities make us rather uncomfortable with its debt levels. But on the bright side, its conversion of EBIT to free cash flow is a good sign, and makes us more optimistic. Taking into account all the aforementioned factors, it looks like KCC has too much debt. While some investors love that sort of risky play, it's certainly not our cup of tea. When analysing debt levels, the balance sheet is the obvious place to start. But ultimately, every company can contain risks that exist outside of the balance sheet. These risks can be hard to spot. Every company has them, and we've spotted 3 warning signs for KCC (of which 2 are significant!) you should know about.
When all is said and done, sometimes its easier to focus on companies that don't even need debt. Readers can access a list of growth stocks with zero net debt 100% free, right now.
Valuation is complex, but we're here to simplify it.
Discover if KCC might be undervalued or overvalued with our detailed analysis, featuring fair value estimates, potential risks, dividends, insider trades, and its financial condition.
Access Free AnalysisHave feedback on this article? Concerned about the content? Get in touch with us directly. Alternatively, email editorial-team (at) simplywallst.com.
This article by Simply Wall St is general in nature. We provide commentary based on historical data and analyst forecasts only using an unbiased methodology and our articles are not intended to be financial advice. It does not constitute a recommendation to buy or sell any stock, and does not take account of your objectives, or your financial situation. We aim to bring you long-term focused analysis driven by fundamental data. Note that our analysis may not factor in the latest price-sensitive company announcements or qualitative material. Simply Wall St has no position in any stocks mentioned.
Have feedback on this article? Concerned about the content? Get in touch with us directly. Alternatively, email editorial-team@simplywallst.com
About KOSE:A002380
Very undervalued with proven track record.
Similar Companies
Market Insights

Advertisement
Community Narratives
MINISO's fair value is projected at 26.69 with an anticipated PE ratio shift of 20x
Fair Value US$24.03|11.4% undervalued
BE
Community Contributor
Procter & Gamble: A Dividend Giant Facing Slowing Growth
Fair Value US$119.81|23.5% overvalued
AN
Community Contributor
Eli Lilly's Future Growth Driven by Tirzepatide and Favorable Market Conditions
Fair Value US$1.19k|14.0% undervalued
EA
Community Contributor