
Howard Marks put it nicely when he said that, rather than worrying about share price volatility, 'The possibility of permanent loss is the risk I worry about... and every practical investor I know worries about.' It's only natural to consider a company's balance sheet when you examine how risky it is, since debt is often involved when a business collapses. As with many other companies SG Co.,Ltd (KOSDAQ:255220) makes use of debt. But the more important question is: how much risk is that debt creating?
When Is Debt Dangerous?
Debt assists a business until the business has trouble paying it off, either with new capital or with free cash flow. In the worst case scenario, a company can go bankrupt if it cannot pay its creditors. However, a more frequent (but still costly) occurrence is where a company must issue shares at bargain-basement prices, permanently diluting shareholders, just to shore up its balance sheet. Having said that, the most common situation is where a company manages its debt reasonably well - and to its own advantage. The first thing to do when considering how much debt a business uses is to look at its cash and debt together.
What Is SGLtd's Net Debt?
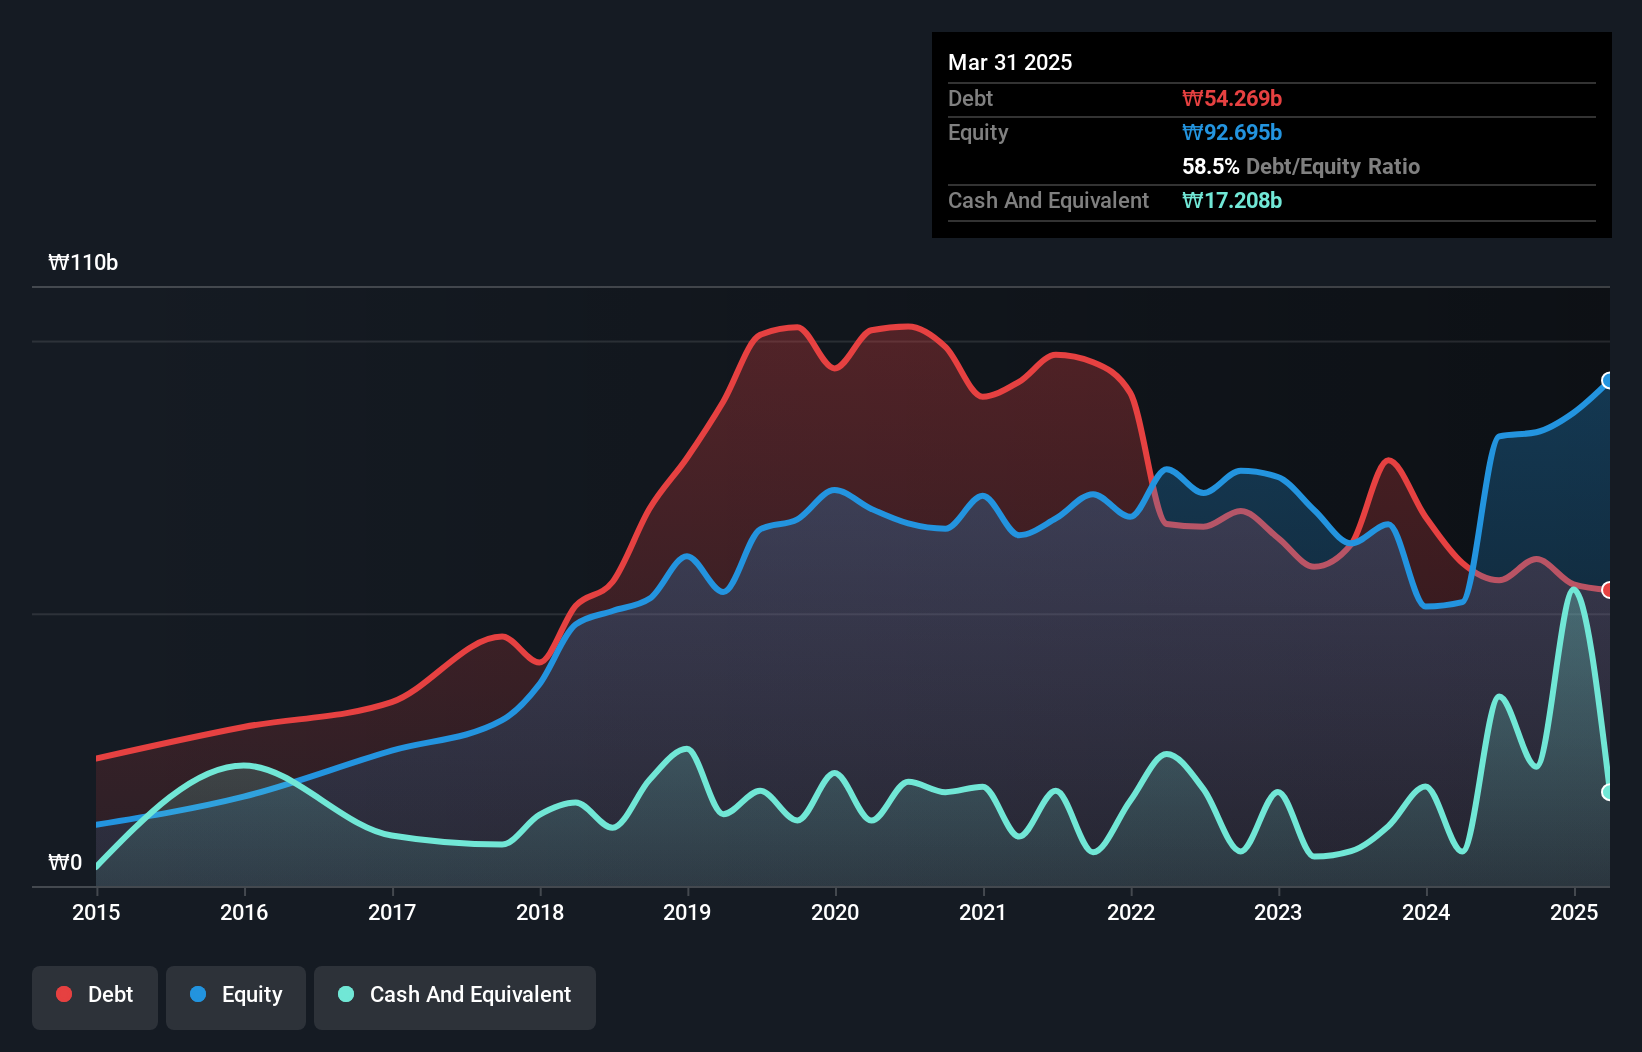
The image below, which you can click on for greater detail, shows that SGLtd had debt of ₩54.3b at the end of March 2025, a reduction from ₩59.2b over a year. On the flip side, it has ₩17.2b in cash leading to net debt of about ₩37.1b.
How Healthy Is SGLtd's Balance Sheet?
We can see from the most recent balance sheet that SGLtd had liabilities of ₩92.7b falling due within a year, and liabilities of ₩21.3b due beyond that. Offsetting these obligations, it had cash of ₩17.2b as well as receivables valued at ₩28.7b due within 12 months. So it has liabilities totalling ₩68.1b more than its cash and near-term receivables, combined.
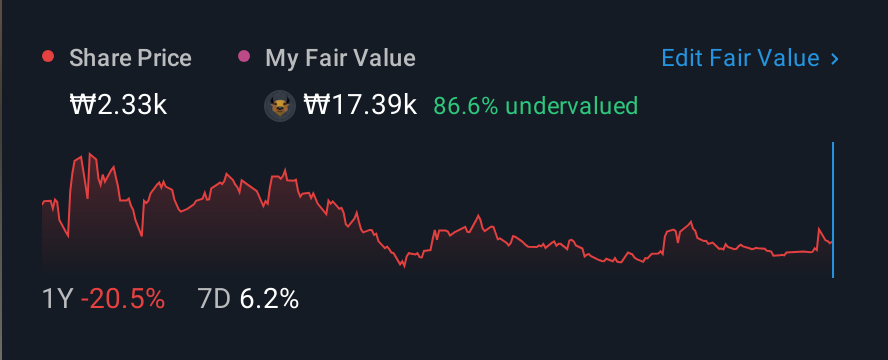
SGLtd has a market capitalization of ₩212.1b, so it could very likely raise cash to ameliorate its balance sheet, if the need arose. But we definitely want to keep our eyes open to indications that its debt is bringing too much risk. When analysing debt levels, the balance sheet is the obvious place to start. But ultimately the future profitability of the business will decide if SGLtd can strengthen its balance sheet over time. So if you're focused on the future you can check out this free report showing analyst profit forecasts.
View our latest analysis for SGLtd
In the last year SGLtd wasn't profitable at an EBIT level, but managed to grow its revenue by 37%, to ₩118b. Shareholders probably have their fingers crossed that it can grow its way to profits.
Caveat Emptor
Despite the top line growth, SGLtd still had an earnings before interest and tax (EBIT) loss over the last year. Indeed, it lost ₩2.6b at the EBIT level. Considering that alongside the liabilities mentioned above does not give us much confidence that company should be using so much debt. So we think its balance sheet is a little strained, though not beyond repair. However, it doesn't help that it burned through ₩26b of cash over the last year. So suffice it to say we consider the stock very risky. There's no doubt that we learn most about debt from the balance sheet. But ultimately, every company can contain risks that exist outside of the balance sheet. To that end, you should be aware of the 3 warning signs we've spotted with SGLtd .
If, after all that, you're more interested in a fast growing company with a rock-solid balance sheet, then check out our list of net cash growth stocks without delay.
The New Payments ETF Is Live on NASDAQ:
Money is moving to real-time rails, and a newly listed ETF now gives investors direct exposure. Fast settlement. Institutional custody. Simple access.
Explore how this launch could reshape portfolios
Sponsored ContentNew: Manage All Your Stock Portfolios in One Place
We've created the ultimate portfolio companion for stock investors, and it's free.
• Connect an unlimited number of Portfolios and see your total in one currency
• Be alerted to new Warning Signs or Risks via email or mobile
• Track the Fair Value of your stocks
Have feedback on this article? Concerned about the content? Get in touch with us directly. Alternatively, email editorial-team (at) simplywallst.com.
This article by Simply Wall St is general in nature. We provide commentary based on historical data and analyst forecasts only using an unbiased methodology and our articles are not intended to be financial advice. It does not constitute a recommendation to buy or sell any stock, and does not take account of your objectives, or your financial situation. We aim to bring you long-term focused analysis driven by fundamental data. Note that our analysis may not factor in the latest price-sensitive company announcements or qualitative material. Simply Wall St has no position in any stocks mentioned.
About KOSDAQ:A255220
SGLtd
Produces and sells asphalt concrete and ready-mixed concrete in South Korea.
Adequate balance sheet with minimal risk.
Market Insights

Weekly Picks

Early mover in a fast growing industry. Likely to experience share price volatility as they scale


A case for CA$31.80 (undiluted), aka 8,616% upside from CA$0.37 (an 86 bagger!).


Moderation and Stabilisation: HOLD: Fair Price based on a 4-year Cycle is $12.08
Recently Updated Narratives

Airbnb Stock: Platform Growth in a World of Saturation and Scrutiny

Adobe Stock: AI-Fueled ARR Growth Pushes Guidance Higher, But Cost Pressures Loom

Thomson Reuters Stock: When Legal Intelligence Becomes Mission-Critical Infrastructure
Popular Narratives


Crazy Undervalued 42 Baggers Silver Play (Active & Running Mine)


NVDA: Expanding AI Demand Will Drive Major Data Center Investments Through 2026

The AI Infrastructure Giant Grows Into Its Valuation
Trending Discussion


