
Advertisement
YMT Co., Ltd. (KOSDAQ:251370), might not be a large cap stock, but it saw a double-digit share price rise of over 10% in the past couple of months on the KOSDAQ. Less-covered, small caps sees more of an opportunity for mispricing due to the lack of information available to the public, which can be a good thing. So, could the stock still be trading at a low price relative to its actual value? Today I will analyse the most recent data on YMT’s outlook and valuation to see if the opportunity still exists.
View our latest analysis for YMT
What's the opportunity in YMT?
The share price seems sensible at the moment according to my price multiple model, where I compare the company's price-to-earnings ratio to the industry average. In this instance, I’ve used the price-to-earnings (PE) ratio given that there is not enough information to reliably forecast the stock’s cash flows. I find that YMT’s ratio of 22.44x is trading slightly above its industry peers’ ratio of 19.88x, which means if you buy YMT today, you’d be paying a relatively reasonable price for it. And if you believe that YMT should be trading at this level in the long run, then there should only be a fairly immaterial downside vs other industry peers. So, is there another chance to buy low in the future? Given that YMT’s share is fairly volatile (i.e. its price movements are magnified relative to the rest of the market) this could mean the price can sink lower, giving us an opportunity to buy later on. This is based on its high beta, which is a good indicator for share price volatility.
Can we expect growth from YMT?
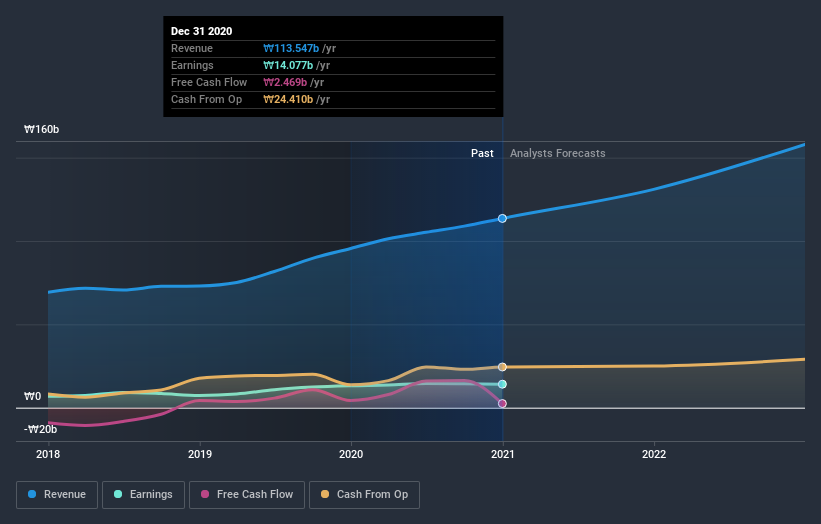
Future outlook is an important aspect when you’re looking at buying a stock, especially if you are an investor looking for growth in your portfolio. Buying a great company with a robust outlook at a cheap price is always a good investment, so let’s also take a look at the company's future expectations. With revenues expected to grow by 39% over the next couple of years, the future seems bright for YMT. If the level of expenses is able to be maintained, it looks like higher cash flow is on the cards for the stock, which should feed into a higher share valuation.
What this means for you:
Are you a shareholder? A251370’s optimistic future growth appears to have been factored into the current share price, with shares trading around industry price multiples. However, there are also other important factors which we haven’t considered today, such as the track record of its management team. Have these factors changed since the last time you looked at A251370? Will you have enough confidence to invest in the company should the price drop below the industry PE ratio?
Are you a potential investor? If you’ve been keeping an eye on A251370, now may not be the most optimal time to buy, given it is trading around industry price multiples. However, the positive outlook is encouraging for A251370, which means it’s worth diving deeper into other factors such as the strength of its balance sheet, in order to take advantage of the next price drop.
In light of this, if you'd like to do more analysis on the company, it's vital to be informed of the risks involved. You'd be interested to know, that we found 2 warning signs for YMT and you'll want to know about these.
If you are no longer interested in YMT, you can use our free platform to see our list of over 50 other stocks with a high growth potential.
When trading YMT or any other investment, use the platform considered by many to be the Professional's Gateway to the Worlds Market, Interactive Brokers. You get the lowest-cost* trading on stocks, options, futures, forex, bonds and funds worldwide from a single integrated account. Promoted
New: Manage All Your Stock Portfolios in One Place
We've created the ultimate portfolio companion for stock investors, and it's free.
• Connect an unlimited number of Portfolios and see your total in one currency
• Be alerted to new Warning Signs or Risks via email or mobile
• Track the Fair Value of your stocks
This article by Simply Wall St is general in nature. It does not constitute a recommendation to buy or sell any stock, and does not take account of your objectives, or your financial situation. We aim to bring you long-term focused analysis driven by fundamental data. Note that our analysis may not factor in the latest price-sensitive company announcements or qualitative material. Simply Wall St has no position in any stocks mentioned.
*Interactive Brokers Rated Lowest Cost Broker by StockBrokers.com Annual Online Review 2020
Have feedback on this article? Concerned about the content? Get in touch with us directly. Alternatively, email editorial-team (at) simplywallst.com.
About KOSDAQ:A251370
YMT
Engages in the electronics manufacturing chemicals and metal tables in South Korea and internationally.
Adequate balance sheet with low risk.
Market Insights

Advertisement
Community Narratives
The company that turned a verb into a global necessity and basically runs the modern internet, digital ads, smartphones, maps, and AI.
Fair Value US$300.00|10.2% undervalued
OS
Community Contributor
Flowers Foods Pays A Fair Price For Health
Fair Value US$16.12|20.3% undervalued
NV
Community Contributor
TMX Group will thrive with 33.3% profit margin and enduring market moat
Fair Value CA$49.90|0.1% undervalued
LI
Community Contributor