
Advertisement
- South Korea
- /
- Chemicals
- /
- KOSDAQ:A250930
YeSUN TechLtd (KOSDAQ:250930) Has Debt But No Earnings; Should You Worry?
Some say volatility, rather than debt, is the best way to think about risk as an investor, but Warren Buffett famously said that 'Volatility is far from synonymous with risk.' So it might be obvious that you need to consider debt, when you think about how risky any given stock is, because too much debt can sink a company. As with many other companies YeSUN Tech Co.,Ltd. (KOSDAQ:250930) makes use of debt. But the real question is whether this debt is making the company risky.
When Is Debt A Problem?
Debt and other liabilities become risky for a business when it cannot easily fulfill those obligations, either with free cash flow or by raising capital at an attractive price. If things get really bad, the lenders can take control of the business. However, a more usual (but still expensive) situation is where a company must dilute shareholders at a cheap share price simply to get debt under control. Of course, debt can be an important tool in businesses, particularly capital heavy businesses. When we think about a company's use of debt, we first look at cash and debt together.
Check out our latest analysis for YeSUN TechLtd
How Much Debt Does YeSUN TechLtd Carry?
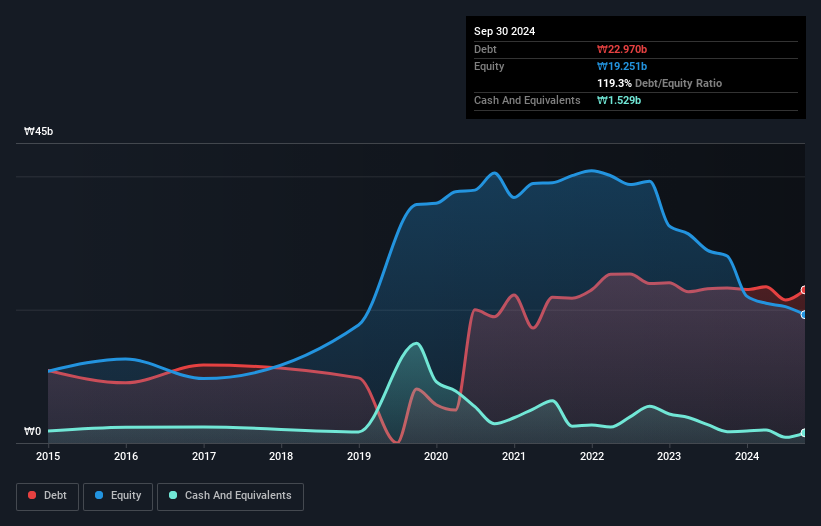
As you can see below, YeSUN TechLtd had ₩23.0b of debt, at September 2024, which is about the same as the year before. You can click the chart for greater detail. However, it also had ₩1.53b in cash, and so its net debt is ₩21.4b.
How Healthy Is YeSUN TechLtd's Balance Sheet?
According to the last reported balance sheet, YeSUN TechLtd had liabilities of ₩27.2b due within 12 months, and liabilities of ₩9.25b due beyond 12 months. Offsetting these obligations, it had cash of ₩1.53b as well as receivables valued at ₩11.6b due within 12 months. So its liabilities outweigh the sum of its cash and (near-term) receivables by ₩23.3b.
This deficit casts a shadow over the ₩12.4b company, like a colossus towering over mere mortals. So we'd watch its balance sheet closely, without a doubt. After all, YeSUN TechLtd would likely require a major re-capitalisation if it had to pay its creditors today. When analysing debt levels, the balance sheet is the obvious place to start. But you can't view debt in total isolation; since YeSUN TechLtd will need earnings to service that debt. So when considering debt, it's definitely worth looking at the earnings trend. Click here for an interactive snapshot.
Over 12 months, YeSUN TechLtd reported revenue of ₩47b, which is a gain of 4.9%, although it did not report any earnings before interest and tax. That rate of growth is a bit slow for our taste, but it takes all types to make a world.
Caveat Emptor
Over the last twelve months YeSUN TechLtd produced an earnings before interest and tax (EBIT) loss. Its EBIT loss was a whopping ₩6.7b. When we look at that alongside the significant liabilities, we're not particularly confident about the company. We'd want to see some strong near-term improvements before getting too interested in the stock. For example, we would not want to see a repeat of last year's loss of ₩8.4b. And until that time we think this is a risky stock. There's no doubt that we learn most about debt from the balance sheet. However, not all investment risk resides within the balance sheet - far from it. For example, we've discovered 3 warning signs for YeSUN TechLtd that you should be aware of before investing here.
If you're interested in investing in businesses that can grow profits without the burden of debt, then check out this free list of growing businesses that have net cash on the balance sheet.
New: Manage All Your Stock Portfolios in One Place
We've created the ultimate portfolio companion for stock investors, and it's free.
• Connect an unlimited number of Portfolios and see your total in one currency
• Be alerted to new Warning Signs or Risks via email or mobile
• Track the Fair Value of your stocks
Have feedback on this article? Concerned about the content? Get in touch with us directly. Alternatively, email editorial-team (at) simplywallst.com.
This article by Simply Wall St is general in nature. We provide commentary based on historical data and analyst forecasts only using an unbiased methodology and our articles are not intended to be financial advice. It does not constitute a recommendation to buy or sell any stock, and does not take account of your objectives, or your financial situation. We aim to bring you long-term focused analysis driven by fundamental data. Note that our analysis may not factor in the latest price-sensitive company announcements or qualitative material. Simply Wall St has no position in any stocks mentioned.
About KOSDAQ:A250930
YeSUN TechLtd
Engages in the manufacture and sale of tapes, tape-related products, and adhesive solutions in South Korea and internationally.
Mediocre balance sheet with low risk.
Market Insights

Advertisement
Community Narratives
Finding The True Value Of A Logistics Powerhouse
Fair Value US$95.21|8.4% undervalued
NV
Community Contributor
Paradigm Biopharmaceuticals Will Lead Osteoarthritis Treatment with Zilosul's FDA Success
Fair Value AU$5.50|92.1% undervalued
AM
Community Contributor
Barrick Mining (ABX:CA): A Gold Hedge against a U.S. Shutdown
Fair Value CA$60.00|24.2% undervalued
GM
Community Contributor