
Advertisement
- South Korea
- /
- Chemicals
- /
- KOSDAQ:A005290
Could The Market Be Wrong About Dongjin Semichem Co., Ltd. (KOSDAQ:005290) Given Its Attractive Financial Prospects?

Dongjin Semichem (KOSDAQ:005290) has had a rough three months with its share price down 26%. However, stock prices are usually driven by a company’s financial performance over the long term, which in this case looks quite promising. Specifically, we decided to study Dongjin Semichem's ROE in this article.
Return on Equity or ROE is a test of how effectively a company is growing its value and managing investors’ money. In short, ROE shows the profit each dollar generates with respect to its shareholder investments.
View our latest analysis for Dongjin Semichem
How Is ROE Calculated?
The formula for return on equity is:
Return on Equity = Net Profit (from continuing operations) ÷ Shareholders' Equity
So, based on the above formula, the ROE for Dongjin Semichem is:
15% = ₩136b ÷ ₩934b (Based on the trailing twelve months to June 2024).
The 'return' is the yearly profit. One way to conceptualize this is that for each ₩1 of shareholders' capital it has, the company made ₩0.15 in profit.
Why Is ROE Important For Earnings Growth?
Thus far, we have learned that ROE measures how efficiently a company is generating its profits. Based on how much of its profits the company chooses to reinvest or "retain", we are then able to evaluate a company's future ability to generate profits. Assuming all else is equal, companies that have both a higher return on equity and higher profit retention are usually the ones that have a higher growth rate when compared to companies that don't have the same features.
Dongjin Semichem's Earnings Growth And 15% ROE
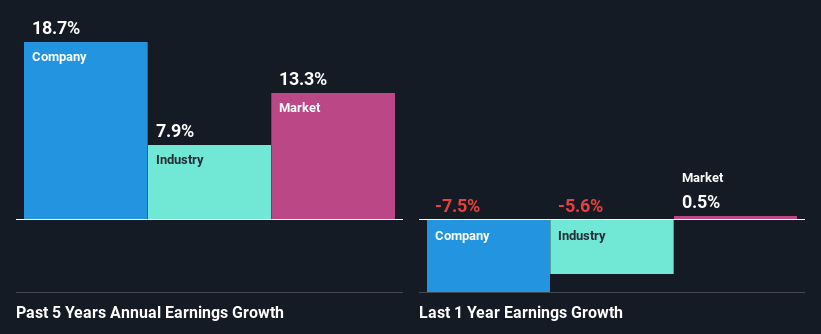
To start with, Dongjin Semichem's ROE looks acceptable. On comparing with the average industry ROE of 6.4% the company's ROE looks pretty remarkable. This probably laid the ground for Dongjin Semichem's moderate 19% net income growth seen over the past five years.
We then compared Dongjin Semichem's net income growth with the industry and we're pleased to see that the company's growth figure is higher when compared with the industry which has a growth rate of 7.9% in the same 5-year period.
The basis for attaching value to a company is, to a great extent, tied to its earnings growth. The investor should try to establish if the expected growth or decline in earnings, whichever the case may be, is priced in. This then helps them determine if the stock is placed for a bright or bleak future. If you're wondering about Dongjin Semichem's's valuation, check out this gauge of its price-to-earnings ratio, as compared to its industry.
Is Dongjin Semichem Making Efficient Use Of Its Profits?
In Dongjin Semichem's case, its respectable earnings growth can probably be explained by its low three-year median payout ratio of 4.8% (or a retention ratio of 95%), which suggests that the company is investing most of its profits to grow its business.
Moreover, Dongjin Semichem is determined to keep sharing its profits with shareholders which we infer from its long history of five years of paying a dividend.
Summary
Overall, we are quite pleased with Dongjin Semichem's performance. Particularly, we like that the company is reinvesting heavily into its business, and at a high rate of return. Unsurprisingly, this has led to an impressive earnings growth. If the company continues to grow its earnings the way it has, that could have a positive impact on its share price given how earnings per share influence long-term share prices. Not to forget, share price outcomes are also dependent on the potential risks a company may face. So it is important for investors to be aware of the risks involved in the business. To know the 1 risk we have identified for Dongjin Semichem visit our risks dashboard for free.
New: Manage All Your Stock Portfolios in One Place
We've created the ultimate portfolio companion for stock investors, and it's free.
• Connect an unlimited number of Portfolios and see your total in one currency
• Be alerted to new Warning Signs or Risks via email or mobile
• Track the Fair Value of your stocks
Have feedback on this article? Concerned about the content? Get in touch with us directly. Alternatively, email editorial-team (at) simplywallst.com.
This article by Simply Wall St is general in nature. We provide commentary based on historical data and analyst forecasts only using an unbiased methodology and our articles are not intended to be financial advice. It does not constitute a recommendation to buy or sell any stock, and does not take account of your objectives, or your financial situation. We aim to bring you long-term focused analysis driven by fundamental data. Note that our analysis may not factor in the latest price-sensitive company announcements or qualitative material. Simply Wall St has no position in any stocks mentioned.
About KOSDAQ:A005290
Dongjin Semichem
Manufactures and supplies electronic materials and foaming agents.
Flawless balance sheet with solid track record.
Similar Companies
Market Insights


Advertisement
Community Narratives
MicroStrategy: Volatile Gamble or Golden Opportunity?
Fair Value US$663.00|32.0% undervalued
BL
Community Contributor
Emerging Markets and Debt Reduction Will Propel Bath & Body Works Forward
Fair Value US$40.73|21.7% undervalued
ZW
Community Contributor
An amazing opportunity to potentially get a 100 bagger
Fair Value US$10.00|0.5% overvalued
DA
Community Contributor