Stock Analysis
- South Korea
- /
- Personal Products
- /
- KOSDAQ:A260930
CTK (KOSDAQ:260930) jumps 18% this week, taking one-year gains to 34%


These days it's easy to simply buy an index fund, and your returns should (roughly) match the market. But if you pick the right individual stocks, you could make more than that. For example, the CTK Co., Ltd (KOSDAQ:260930) share price is up 32% in the last 1 year, clearly besting the market return of around 3.1% (not including dividends). So that should have shareholders smiling. Zooming out, the stock is actually down 14% in the last three years.
After a strong gain in the past week, it's worth seeing if longer term returns have been driven by improving fundamentals.
View our latest analysis for CTK
While the efficient markets hypothesis continues to be taught by some, it has been proven that markets are over-reactive dynamic systems, and investors are not always rational. One way to examine how market sentiment has changed over time is to look at the interaction between a company's share price and its earnings per share (EPS).
CTK went from making a loss to reporting a profit, in the last year.
When a company has just transitioned to profitability, earnings per share growth is not always the best way to look at the share price action.
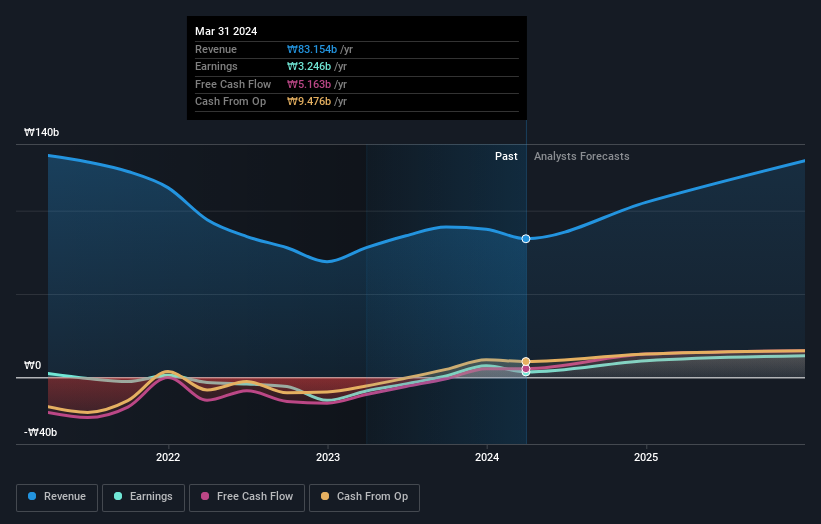
We are skeptical of the suggestion that the 1.2% dividend yield would entice buyers to the stock. We think that the revenue growth of 6.9% could have some investors interested. Many businesses do go through a phase where they have to forgo some profits to drive business development, and sometimes its for the best.
You can see how earnings and revenue have changed over time in the image below (click on the chart to see the exact values).
We know that CTK has improved its bottom line lately, but what does the future have in store? This free report showing analyst forecasts should help you form a view on CTK
What About Dividends?
It is important to consider the total shareholder return, as well as the share price return, for any given stock. The TSR is a return calculation that accounts for the value of cash dividends (assuming that any dividend received was reinvested) and the calculated value of any discounted capital raisings and spin-offs. So for companies that pay a generous dividend, the TSR is often a lot higher than the share price return. We note that for CTK the TSR over the last 1 year was 34%, which is better than the share price return mentioned above. This is largely a result of its dividend payments!
A Different Perspective
It's nice to see that CTK shareholders have received a total shareholder return of 34% over the last year. That's including the dividend. There's no doubt those recent returns are much better than the TSR loss of 3% per year over five years. This makes us a little wary, but the business might have turned around its fortunes. While it is well worth considering the different impacts that market conditions can have on the share price, there are other factors that are even more important. Case in point: We've spotted 2 warning signs for CTK you should be aware of.
If you are like me, then you will not want to miss this free list of undervalued small caps that insiders are buying.
Please note, the market returns quoted in this article reflect the market weighted average returns of stocks that currently trade on South Korean exchanges.
Valuation is complex, but we're helping make it simple.
Find out whether CTK is potentially over or undervalued by checking out our comprehensive analysis, which includes fair value estimates, risks and warnings, dividends, insider transactions and financial health.
View the Free AnalysisHave feedback on this article? Concerned about the content? Get in touch with us directly. Alternatively, email editorial-team (at) simplywallst.com.
This article by Simply Wall St is general in nature. We provide commentary based on historical data and analyst forecasts only using an unbiased methodology and our articles are not intended to be financial advice. It does not constitute a recommendation to buy or sell any stock, and does not take account of your objectives, or your financial situation. We aim to bring you long-term focused analysis driven by fundamental data. Note that our analysis may not factor in the latest price-sensitive company announcements or qualitative material. Simply Wall St has no position in any stocks mentioned.
About KOSDAQ:A260930
CTK
Manufactures and sells cosmetics and cosmetic containers in South Korea and internationally.
High growth potential with excellent balance sheet.
