
Advertisement
Legendary fund manager Li Lu (who Charlie Munger backed) once said, 'The biggest investment risk is not the volatility of prices, but whether you will suffer a permanent loss of capital.' So it might be obvious that you need to consider debt, when you think about how risky any given stock is, because too much debt can sink a company. We note that Plasmapp Co., Ltd. (KOSDAQ:405000) does have debt on its balance sheet. But the real question is whether this debt is making the company risky.
What Risk Does Debt Bring?
Debt and other liabilities become risky for a business when it cannot easily fulfill those obligations, either with free cash flow or by raising capital at an attractive price. Ultimately, if the company can't fulfill its legal obligations to repay debt, shareholders could walk away with nothing. However, a more common (but still painful) scenario is that it has to raise new equity capital at a low price, thus permanently diluting shareholders. Of course, debt can be an important tool in businesses, particularly capital heavy businesses. When we think about a company's use of debt, we first look at cash and debt together.
What Is Plasmapp's Net Debt?
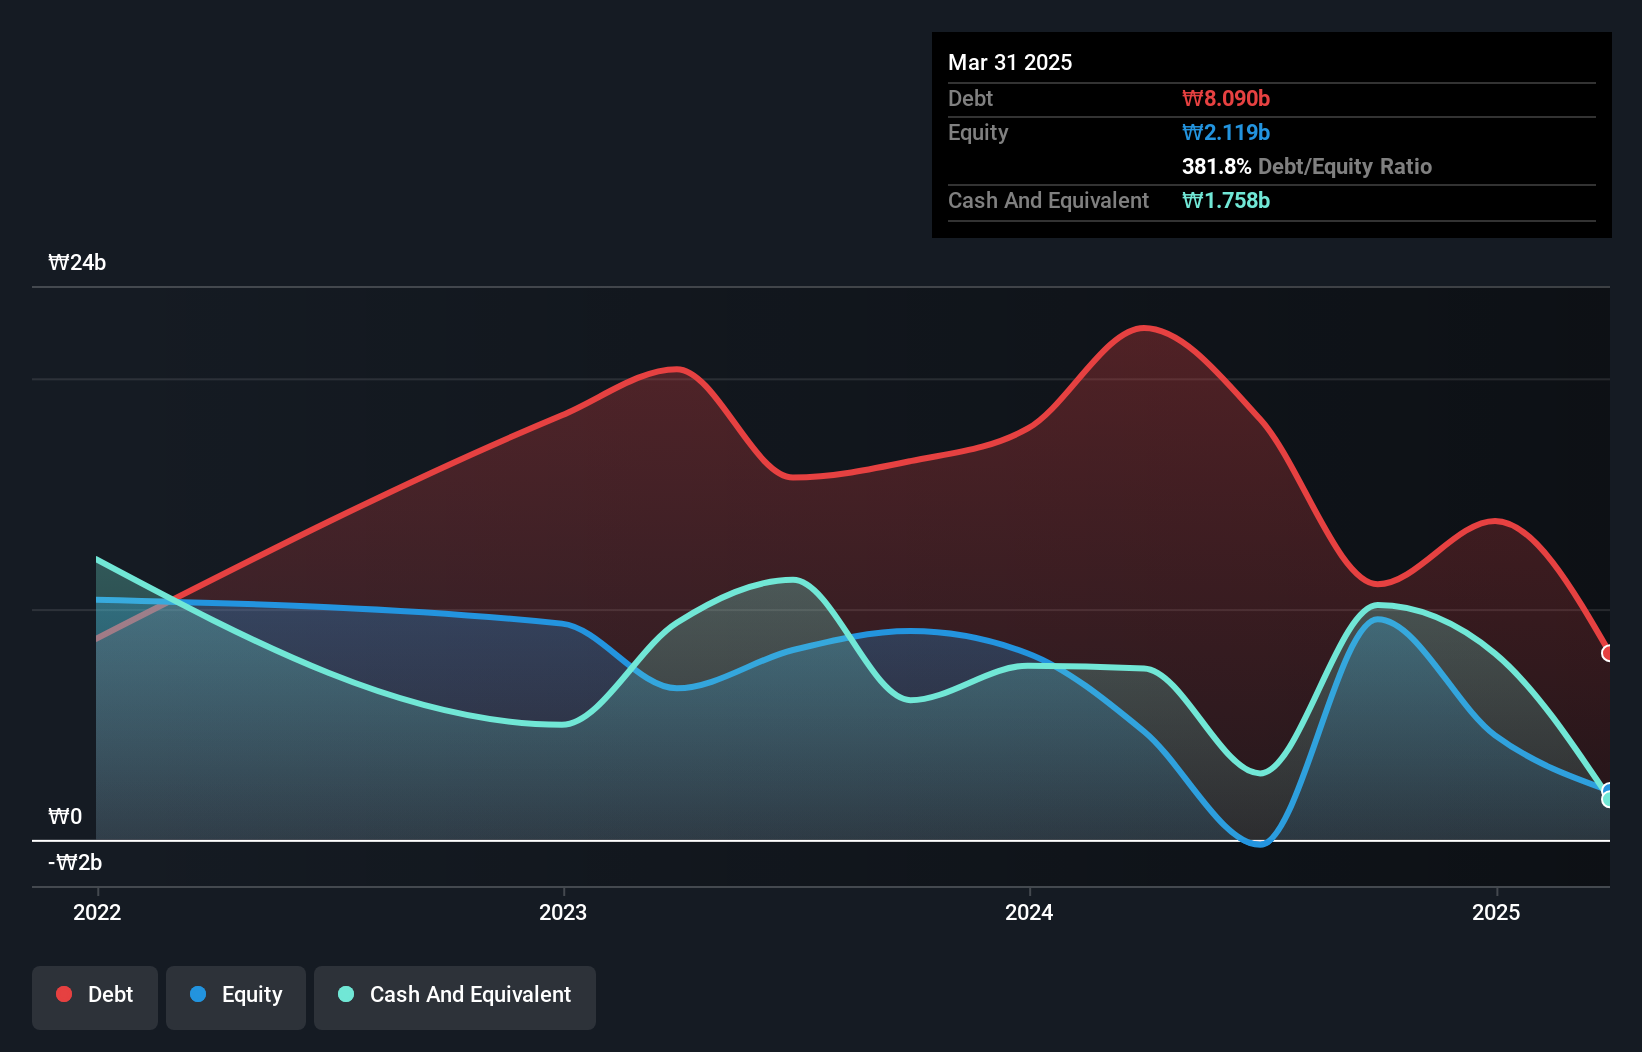
As you can see below, Plasmapp had ₩8.09b of debt at March 2025, down from ₩22.2b a year prior. However, it also had ₩1.76b in cash, and so its net debt is ₩6.33b.
A Look At Plasmapp's Liabilities
We can see from the most recent balance sheet that Plasmapp had liabilities of ₩14.9b falling due within a year, and liabilities of ₩1.27b due beyond that. Offsetting this, it had ₩1.76b in cash and ₩5.03b in receivables that were due within 12 months. So its liabilities total ₩9.41b more than the combination of its cash and short-term receivables.
This deficit isn't so bad because Plasmapp is worth ₩28.8b, and thus could probably raise enough capital to shore up its balance sheet, if the need arose. But we definitely want to keep our eyes open to indications that its debt is bringing too much risk. When analysing debt levels, the balance sheet is the obvious place to start. But it is Plasmapp's earnings that will influence how the balance sheet holds up in the future. So if you're keen to discover more about its earnings, it might be worth checking out this graph of its long term earnings trend.
See our latest analysis for Plasmapp
In the last year Plasmapp had a loss before interest and tax, and actually shrunk its revenue by 54%, to ₩7.1b. That makes us nervous, to say the least.
Caveat Emptor
While Plasmapp's falling revenue is about as heartwarming as a wet blanket, arguably its earnings before interest and tax (EBIT) loss is even less appealing. Its EBIT loss was a whopping ₩17b. Considering that alongside the liabilities mentioned above does not give us much confidence that company should be using so much debt. Quite frankly we think the balance sheet is far from match-fit, although it could be improved with time. However, it doesn't help that it burned through ₩7.1b of cash over the last year. So in short it's a really risky stock. The balance sheet is clearly the area to focus on when you are analysing debt. But ultimately, every company can contain risks that exist outside of the balance sheet. These risks can be hard to spot. Every company has them, and we've spotted 4 warning signs for Plasmapp (of which 3 make us uncomfortable!) you should know about.
When all is said and done, sometimes its easier to focus on companies that don't even need debt. Readers can access a list of growth stocks with zero net debt 100% free, right now.
New: Manage All Your Stock Portfolios in One Place
We've created the ultimate portfolio companion for stock investors, and it's free.
• Connect an unlimited number of Portfolios and see your total in one currency
• Be alerted to new Warning Signs or Risks via email or mobile
• Track the Fair Value of your stocks
Have feedback on this article? Concerned about the content? Get in touch with us directly. Alternatively, email editorial-team (at) simplywallst.com.
This article by Simply Wall St is general in nature. We provide commentary based on historical data and analyst forecasts only using an unbiased methodology and our articles are not intended to be financial advice. It does not constitute a recommendation to buy or sell any stock, and does not take account of your objectives, or your financial situation. We aim to bring you long-term focused analysis driven by fundamental data. Note that our analysis may not factor in the latest price-sensitive company announcements or qualitative material. Simply Wall St has no position in any stocks mentioned.
About KOSDAQ:A405000
Plasmapp
Develops, manufactures, and sells plasma sterilizers for medical tools.
Adequate balance sheet with slight risk.
Market Insights

Advertisement
Community Narratives
MINISO's fair value is projected at 26.69 with an anticipated PE ratio shift of 20x
Fair Value US$24.03|11.0% undervalued
BE
Community Contributor
Procter & Gamble: A Dividend Giant Facing Slowing Growth
Fair Value US$119.81|23.3% overvalued
AN
Community Contributor
Eli Lilly's Future Growth Driven by Tirzepatide and Favorable Market Conditions
Fair Value US$1.19k|13.8% undervalued
EA
Community Contributor