
Advertisement
The external fund manager backed by Berkshire Hathaway's Charlie Munger, Li Lu, makes no bones about it when he says 'The biggest investment risk is not the volatility of prices, but whether you will suffer a permanent loss of capital.' When we think about how risky a company is, we always like to look at its use of debt, since debt overload can lead to ruin. We note that Plasmapp Co., Ltd. (KOSDAQ:405000) does have debt on its balance sheet. But the more important question is: how much risk is that debt creating?
What Risk Does Debt Bring?
Generally speaking, debt only becomes a real problem when a company can't easily pay it off, either by raising capital or with its own cash flow. Part and parcel of capitalism is the process of 'creative destruction' where failed businesses are mercilessly liquidated by their bankers. However, a more frequent (but still costly) occurrence is where a company must issue shares at bargain-basement prices, permanently diluting shareholders, just to shore up its balance sheet. Of course, the upside of debt is that it often represents cheap capital, especially when it replaces dilution in a company with the ability to reinvest at high rates of return. The first step when considering a company's debt levels is to consider its cash and debt together.
Check out our latest analysis for Plasmapp
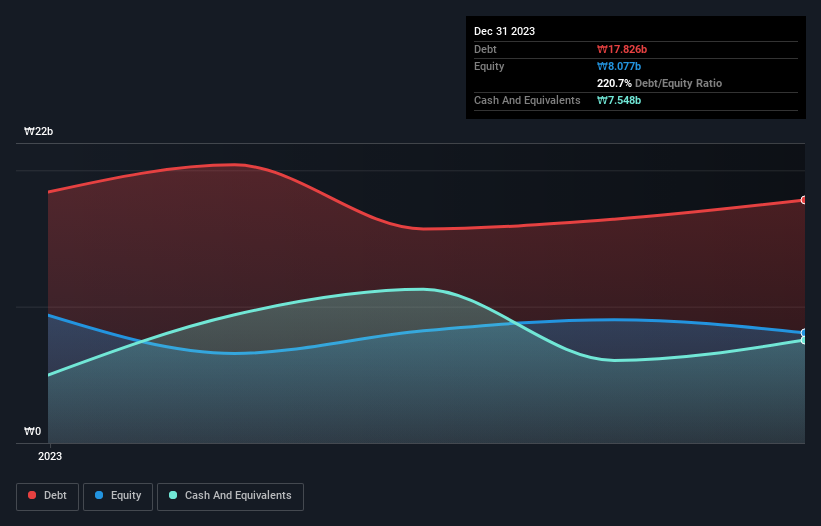
What Is Plasmapp's Net Debt?
As you can see below, Plasmapp had ₩17.8b of debt, at December 2023, which is about the same as the year before. You can click the chart for greater detail. However, because it has a cash reserve of ₩7.55b, its net debt is less, at about ₩10.3b.
How Healthy Is Plasmapp's Balance Sheet?
We can see from the most recent balance sheet that Plasmapp had liabilities of ₩15.8b falling due within a year, and liabilities of ₩15.9b due beyond that. On the other hand, it had cash of ₩7.55b and ₩7.77b worth of receivables due within a year. So it has liabilities totalling ₩16.4b more than its cash and near-term receivables, combined.
This deficit isn't so bad because Plasmapp is worth ₩49.0b, and thus could probably raise enough capital to shore up its balance sheet, if the need arose. But we definitely want to keep our eyes open to indications that its debt is bringing too much risk. When analysing debt levels, the balance sheet is the obvious place to start. But it is Plasmapp's earnings that will influence how the balance sheet holds up in the future. So if you're keen to discover more about its earnings, it might be worth checking out this graph of its long term earnings trend.
Over 12 months, Plasmapp made a loss at the EBIT level, and saw its revenue drop to ₩13b, which is a fall of 2.9%. That's not what we would hope to see.
Caveat Emptor
Over the last twelve months Plasmapp produced an earnings before interest and tax (EBIT) loss. Indeed, it lost a very considerable ₩21b at the EBIT level. Considering that alongside the liabilities mentioned above does not give us much confidence that company should be using so much debt. Quite frankly we think the balance sheet is far from match-fit, although it could be improved with time. However, it doesn't help that it burned through ₩24b of cash over the last year. So in short it's a really risky stock. When analysing debt levels, the balance sheet is the obvious place to start. However, not all investment risk resides within the balance sheet - far from it. To that end, you should learn about the 6 warning signs we've spotted with Plasmapp (including 2 which are a bit unpleasant) .
When all is said and done, sometimes its easier to focus on companies that don't even need debt. Readers can access a list of growth stocks with zero net debt 100% free, right now.
New: Manage All Your Stock Portfolios in One Place
We've created the ultimate portfolio companion for stock investors, and it's free.
• Connect an unlimited number of Portfolios and see your total in one currency
• Be alerted to new Warning Signs or Risks via email or mobile
• Track the Fair Value of your stocks
Have feedback on this article? Concerned about the content? Get in touch with us directly. Alternatively, email editorial-team (at) simplywallst.com.
This article by Simply Wall St is general in nature. We provide commentary based on historical data and analyst forecasts only using an unbiased methodology and our articles are not intended to be financial advice. It does not constitute a recommendation to buy or sell any stock, and does not take account of your objectives, or your financial situation. We aim to bring you long-term focused analysis driven by fundamental data. Note that our analysis may not factor in the latest price-sensitive company announcements or qualitative material. Simply Wall St has no position in any stocks mentioned.
About KOSDAQ:A405000
Plasmapp
Develops, manufactures, and sells plasma sterilizers for medical tools.
Adequate balance sheet with slight risk.
Market Insights

Advertisement
Community Narratives
MINISO's fair value is projected at 26.69 with an anticipated PE ratio shift of 20x
Fair Value US$24.03|11.0% undervalued
BE
Community Contributor
Procter & Gamble: A Dividend Giant Facing Slowing Growth
Fair Value US$119.81|23.3% overvalued
AN
Community Contributor
Eli Lilly's Future Growth Driven by Tirzepatide and Favorable Market Conditions
Fair Value US$1.19k|13.8% undervalued
EA
Community Contributor