
Advertisement
- South Korea
- /
- Healthtech
- /
- KOSDAQ:A322510
Further weakness as JLKInc (KOSDAQ:322510) drops 15% this week, taking one-year losses to 47%

The simplest way to benefit from a rising market is to buy an index fund. When you buy individual stocks, you can make higher profits, but you also face the risk of under-performance. Unfortunately the JLK,Inc. (KOSDAQ:322510) share price slid 52% over twelve months. That falls noticeably short of the market return of around 5.8%. On the bright side, the stock is actually up 33% in the last three years. Shareholders have had an even rougher run lately, with the share price down 28% in the last 90 days.
After losing 15% this past week, it's worth investigating the company's fundamentals to see what we can infer from past performance.
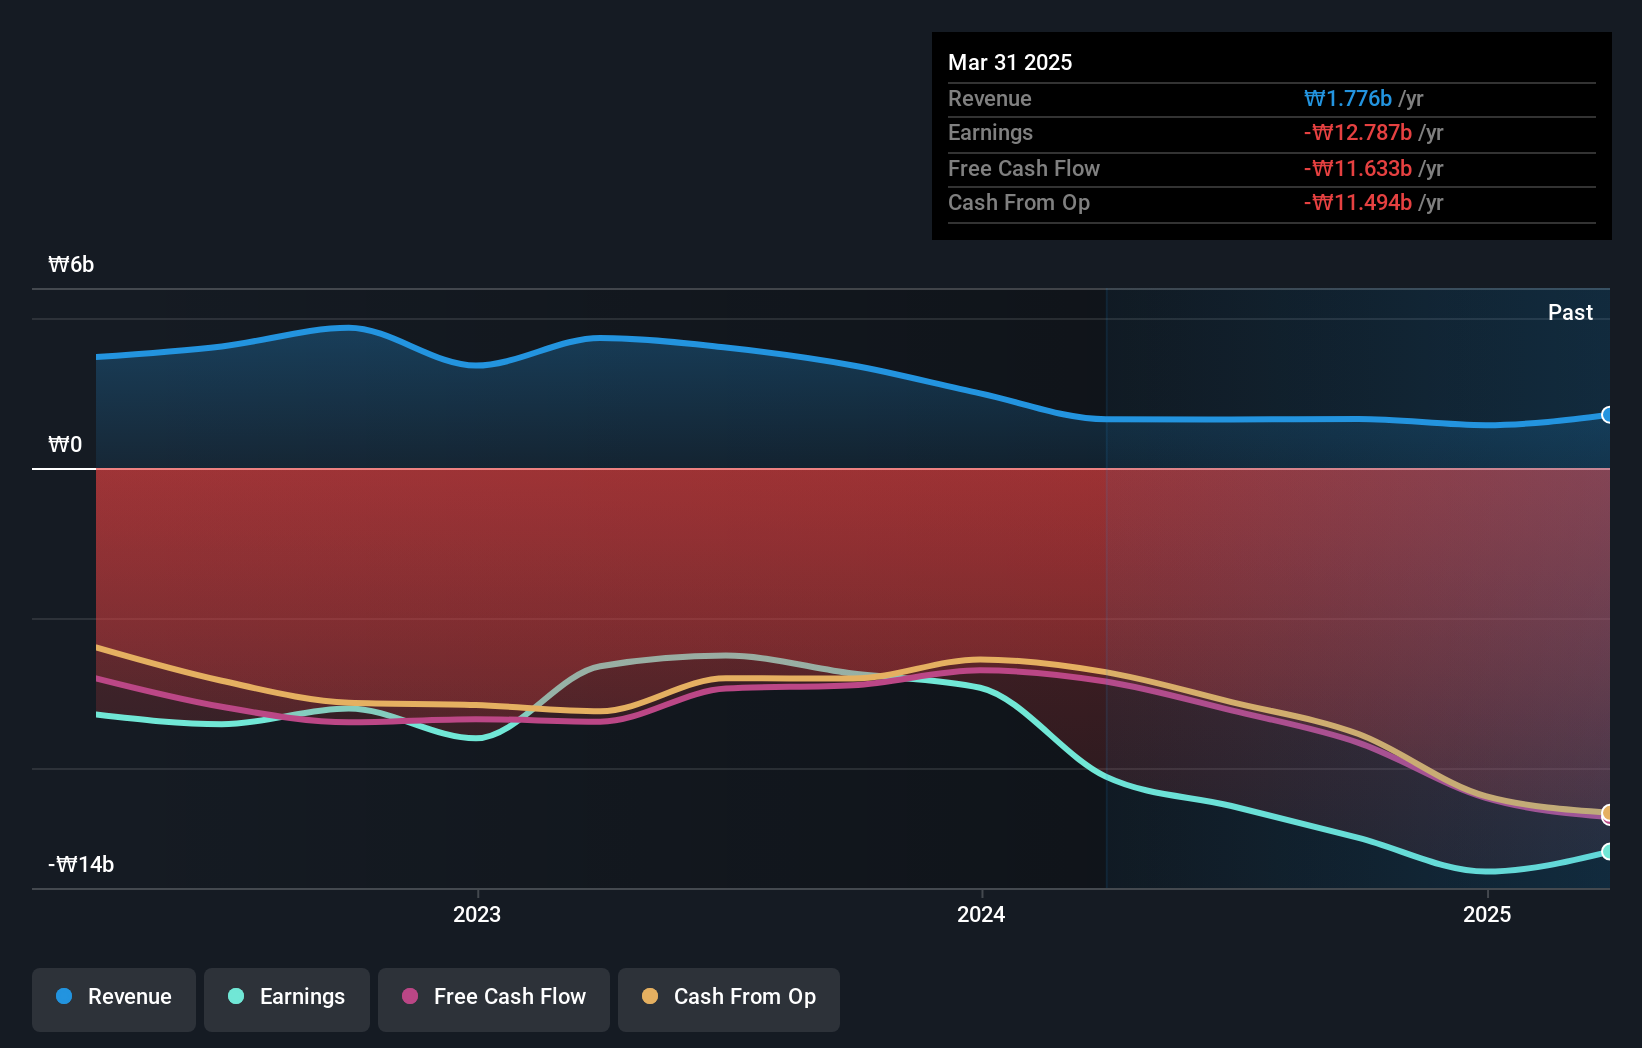
JLKInc isn't currently profitable, so most analysts would look to revenue growth to get an idea of how fast the underlying business is growing. Shareholders of unprofitable companies usually desire strong revenue growth. That's because fast revenue growth can be easily extrapolated to forecast profits, often of considerable size.
JLKInc grew its revenue by 9.2% over the last year. That's not a very high growth rate considering it doesn't make profits. Without profits, and with revenue growth sluggish, you get a 52% loss for shareholders, over the year. Like many holders, we really want to see better revenue growth in companies that lose money. Of course, the market can be too impatient at times. Why not take a closer look at this one so you're ready to pounce if growth does accelerate.
You can see how earnings and revenue have changed over time in the image below (click on the chart to see the exact values).
Balance sheet strength is crucial. It might be well worthwhile taking a look at our free report on how its financial position has changed over time.

What About The Total Shareholder Return (TSR)?
Investors should note that there's a difference between JLKInc's total shareholder return (TSR) and its share price change, which we've covered above. The TSR is a return calculation that accounts for the value of cash dividends (assuming that any dividend received was reinvested) and the calculated value of any discounted capital raisings and spin-offs. JLKInc hasn't been paying dividends, but its TSR of -47% exceeds its share price return of -52%, implying it has either spun-off a business, or raised capital at a discount; thereby providing additional value to shareholders.
A Different Perspective
JLKInc shareholders are down 47% for the year, but the market itself is up 5.8%. Even the share prices of good stocks drop sometimes, but we want to see improvements in the fundamental metrics of a business, before getting too interested. Regrettably, last year's performance caps off a bad run, with the shareholders facing a total loss of 0.3% per year over five years. We realise that Baron Rothschild has said investors should "buy when there is blood on the streets", but we caution that investors should first be sure they are buying a high quality business. It's always interesting to track share price performance over the longer term. But to understand JLKInc better, we need to consider many other factors. To that end, you should learn about the 3 warning signs we've spotted with JLKInc (including 2 which shouldn't be ignored) .
If you like to buy stocks alongside management, then you might just love this free list of companies. (Hint: many of them are unnoticed AND have attractive valuation).
Please note, the market returns quoted in this article reflect the market weighted average returns of stocks that currently trade on South Korean exchanges.
New: Manage All Your Stock Portfolios in One Place
We've created the ultimate portfolio companion for stock investors, and it's free.
• Connect an unlimited number of Portfolios and see your total in one currency
• Be alerted to new Warning Signs or Risks via email or mobile
• Track the Fair Value of your stocks
Have feedback on this article? Concerned about the content? Get in touch with us directly. Alternatively, email editorial-team (at) simplywallst.com.
This article by Simply Wall St is general in nature. We provide commentary based on historical data and analyst forecasts only using an unbiased methodology and our articles are not intended to be financial advice. It does not constitute a recommendation to buy or sell any stock, and does not take account of your objectives, or your financial situation. We aim to bring you long-term focused analysis driven by fundamental data. Note that our analysis may not factor in the latest price-sensitive company announcements or qualitative material. Simply Wall St has no position in any stocks mentioned.
About KOSDAQ:A322510
JLKInc
JLK, Inc. provides diagnosis support to the patients with it AI-driven solutions in South Korea.
Excellent balance sheet low.
Market Insights

Advertisement
Community Narratives
Vita Life Sciences Set for a 12.72% Revenue Growth While Tackling Operational Challenges
Fair Value AU$2.42|12.0% undervalued
RO
Community Contributor
Vossloh rides a €500 billion wave to boost growth and earnings in the next decade
Fair Value €78.41|5.2% undervalued
CH
Community Contributor
Intuitive Surgical Will Transform Healthcare with 12% Revenue Growth
Fair Value US$325.55|57.3% overvalued
UN
Community Contributor