
Advertisement
Some say volatility, rather than debt, is the best way to think about risk as an investor, but Warren Buffett famously said that 'Volatility is far from synonymous with risk.' So it might be obvious that you need to consider debt, when you think about how risky any given stock is, because too much debt can sink a company. Importantly, WSI Co., Ltd. (KOSDAQ:299170) does carry debt. But the more important question is: how much risk is that debt creating?
When Is Debt Dangerous?
Debt assists a business until the business has trouble paying it off, either with new capital or with free cash flow. If things get really bad, the lenders can take control of the business. However, a more frequent (but still costly) occurrence is where a company must issue shares at bargain-basement prices, permanently diluting shareholders, just to shore up its balance sheet. By replacing dilution, though, debt can be an extremely good tool for businesses that need capital to invest in growth at high rates of return. When we think about a company's use of debt, we first look at cash and debt together.
What Is WSI's Net Debt?
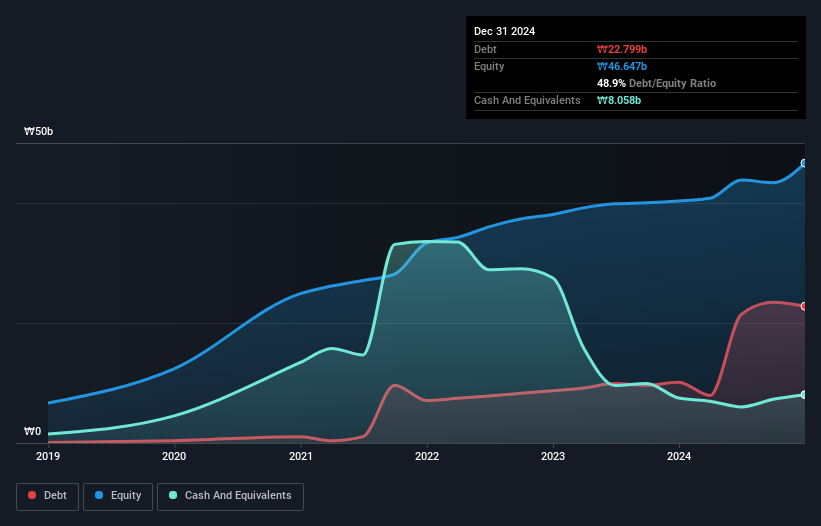
You can click the graphic below for the historical numbers, but it shows that as of December 2024 WSI had ₩22.8b of debt, an increase on ₩10.1b, over one year. However, because it has a cash reserve of ₩8.06b, its net debt is less, at about ₩14.7b.
A Look At WSI's Liabilities
The latest balance sheet data shows that WSI had liabilities of ₩32.9b due within a year, and liabilities of ₩5.83b falling due after that. On the other hand, it had cash of ₩8.06b and ₩11.7b worth of receivables due within a year. So its liabilities outweigh the sum of its cash and (near-term) receivables by ₩19.0b.
This deficit isn't so bad because WSI is worth ₩51.0b, and thus could probably raise enough capital to shore up its balance sheet, if the need arose. However, it is still worthwhile taking a close look at its ability to pay off debt.
Check out our latest analysis for WSI
In order to size up a company's debt relative to its earnings, we calculate its net debt divided by its earnings before interest, tax, depreciation, and amortization (EBITDA) and its earnings before interest and tax (EBIT) divided by its interest expense (its interest cover). This way, we consider both the absolute quantum of the debt, as well as the interest rates paid on it.
While we wouldn't worry about WSI's net debt to EBITDA ratio of 2.9, we think its super-low interest cover of 2.1 times is a sign of high leverage. It seems clear that the cost of borrowing money is negatively impacting returns for shareholders, of late. However, one redeeming factor is that WSI grew its EBIT at 15% over the last 12 months, boosting its ability to handle its debt. There's no doubt that we learn most about debt from the balance sheet. But you can't view debt in total isolation; since WSI will need earnings to service that debt. So if you're keen to discover more about its earnings, it might be worth checking out this graph of its long term earnings trend.
But our final consideration is also important, because a company cannot pay debt with paper profits; it needs cold hard cash. So we clearly need to look at whether that EBIT is leading to corresponding free cash flow. Over the last three years, WSI saw substantial negative free cash flow, in total. While investors are no doubt expecting a reversal of that situation in due course, it clearly does mean its use of debt is more risky.
Our View
Both WSI's conversion of EBIT to free cash flow and its interest cover were discouraging. But its not so bad at growing its EBIT. It's also worth noting that WSI is in the Healthcare industry, which is often considered to be quite defensive. Taking the abovementioned factors together we do think WSI's debt poses some risks to the business. So while that leverage does boost returns on equity, we wouldn't really want to see it increase from here. The balance sheet is clearly the area to focus on when you are analysing debt. But ultimately, every company can contain risks that exist outside of the balance sheet. For instance, we've identified 3 warning signs for WSI that you should be aware of.
Of course, if you're the type of investor who prefers buying stocks without the burden of debt, then don't hesitate to discover our exclusive list of net cash growth stocks, today.
Valuation is complex, but we're here to simplify it.
Discover if WSI might be undervalued or overvalued with our detailed analysis, featuring fair value estimates, potential risks, dividends, insider trades, and its financial condition.
Access Free AnalysisHave feedback on this article? Concerned about the content? Get in touch with us directly. Alternatively, email editorial-team (at) simplywallst.com.
This article by Simply Wall St is general in nature. We provide commentary based on historical data and analyst forecasts only using an unbiased methodology and our articles are not intended to be financial advice. It does not constitute a recommendation to buy or sell any stock, and does not take account of your objectives, or your financial situation. We aim to bring you long-term focused analysis driven by fundamental data. Note that our analysis may not factor in the latest price-sensitive company announcements or qualitative material. Simply Wall St has no position in any stocks mentioned.
About KOSDAQ:A299170
Slight risk with imperfect balance sheet.
Market Insights

Advertisement
Community Narratives
MINISO's fair value is projected at 26.69 with an anticipated PE ratio shift of 20x
Fair Value US$24.03|11.0% undervalued
BE
Community Contributor
Procter & Gamble: A Dividend Giant Facing Slowing Growth
Fair Value US$119.81|23.3% overvalued
AN
Community Contributor
Eli Lilly's Future Growth Driven by Tirzepatide and Favorable Market Conditions
Fair Value US$1.19k|13.8% undervalued
EA
Community Contributor