
Advertisement
- South Korea
- /
- Medical Equipment
- /
- KOSDAQ:A226400
OSTEONIC (KOSDAQ:226400) Seems To Use Debt Rather Sparingly
David Iben put it well when he said, 'Volatility is not a risk we care about. What we care about is avoiding the permanent loss of capital.' When we think about how risky a company is, we always like to look at its use of debt, since debt overload can lead to ruin. We can see that OSTEONIC Co., Ltd. (KOSDAQ:226400) does use debt in its business. But should shareholders be worried about its use of debt?
When Is Debt A Problem?
Debt assists a business until the business has trouble paying it off, either with new capital or with free cash flow. Ultimately, if the company can't fulfill its legal obligations to repay debt, shareholders could walk away with nothing. While that is not too common, we often do see indebted companies permanently diluting shareholders because lenders force them to raise capital at a distressed price. Having said that, the most common situation is where a company manages its debt reasonably well - and to its own advantage. The first thing to do when considering how much debt a business uses is to look at its cash and debt together.
View our latest analysis for OSTEONIC
How Much Debt Does OSTEONIC Carry?
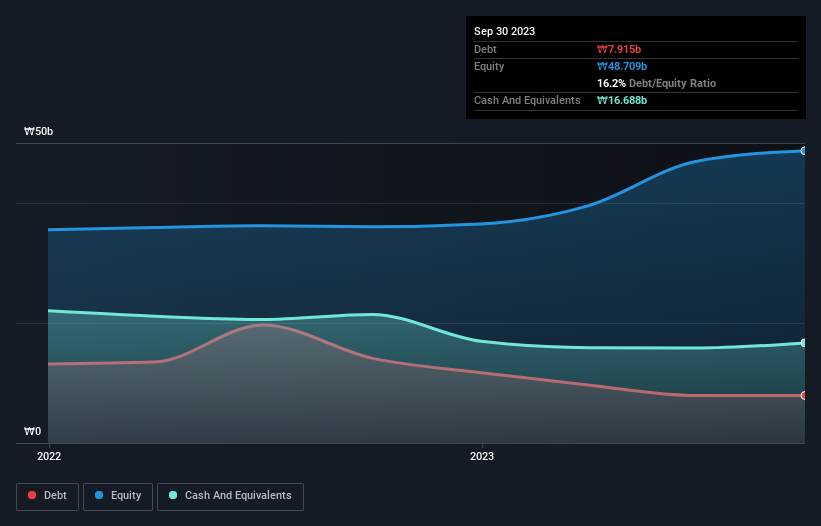
You can click the graphic below for the historical numbers, but it shows that OSTEONIC had ₩7.92b of debt in September 2023, down from ₩14.1b, one year before. However, its balance sheet shows it holds ₩16.7b in cash, so it actually has ₩8.77b net cash.
How Healthy Is OSTEONIC's Balance Sheet?
According to the last reported balance sheet, OSTEONIC had liabilities of ₩11.8b due within 12 months, and liabilities of ₩6.36b due beyond 12 months. Offsetting these obligations, it had cash of ₩16.7b as well as receivables valued at ₩10.3b due within 12 months. So it actually has ₩8.86b more liquid assets than total liabilities.
This surplus suggests that OSTEONIC has a conservative balance sheet, and could probably eliminate its debt without much difficulty. Succinctly put, OSTEONIC boasts net cash, so it's fair to say it does not have a heavy debt load!
Even more impressive was the fact that OSTEONIC grew its EBIT by 325% over twelve months. If maintained that growth will make the debt even more manageable in the years ahead. When analysing debt levels, the balance sheet is the obvious place to start. But you can't view debt in total isolation; since OSTEONIC will need earnings to service that debt. So if you're keen to discover more about its earnings, it might be worth checking out this graph of its long term earnings trend.
Finally, a company can only pay off debt with cold hard cash, not accounting profits. While OSTEONIC has net cash on its balance sheet, it's still worth taking a look at its ability to convert earnings before interest and tax (EBIT) to free cash flow, to help us understand how quickly it is building (or eroding) that cash balance. In the last two years, OSTEONIC's free cash flow amounted to 24% of its EBIT, less than we'd expect. That's not great, when it comes to paying down debt.
Summing Up
While we empathize with investors who find debt concerning, you should keep in mind that OSTEONIC has net cash of ₩8.77b, as well as more liquid assets than liabilities. And we liked the look of last year's 325% year-on-year EBIT growth. So is OSTEONIC's debt a risk? It doesn't seem so to us. When analysing debt levels, the balance sheet is the obvious place to start. But ultimately, every company can contain risks that exist outside of the balance sheet. To that end, you should be aware of the 4 warning signs we've spotted with OSTEONIC .
If, after all that, you're more interested in a fast growing company with a rock-solid balance sheet, then check out our list of net cash growth stocks without delay.
New: AI Stock Screener & Alerts
Our new AI Stock Screener scans the market every day to uncover opportunities.
• Dividend Powerhouses (3%+ Yield)
• Undervalued Small Caps with Insider Buying
• High growth Tech and AI Companies
Or build your own from over 50 metrics.
Have feedback on this article? Concerned about the content? Get in touch with us directly. Alternatively, email editorial-team (at) simplywallst.com.
This article by Simply Wall St is general in nature. We provide commentary based on historical data and analyst forecasts only using an unbiased methodology and our articles are not intended to be financial advice. It does not constitute a recommendation to buy or sell any stock, and does not take account of your objectives, or your financial situation. We aim to bring you long-term focused analysis driven by fundamental data. Note that our analysis may not factor in the latest price-sensitive company announcements or qualitative material. Simply Wall St has no position in any stocks mentioned.
About KOSDAQ:A226400
OSTEONIC
Osteonic Co., Ltd. develops, manufactures, and sells bone fixation systems.
High growth potential with excellent balance sheet.
Market Insights

Advertisement
Community Narratives
MicroVision will explode future revenue by 380.37% with a vision towards success
Fair Value US$60|98.4% undervalued
TH
Community Contributor
The Indispensable Artery for a New North American Economy
Fair Value CA$132.87|3.6% undervalued
TI
Community Contributor
Recently Updated Narratives
BE


Bejgal on MINISO Group Holding ·
MINISO's fair value is projected at 26.69 with an anticipated PE ratio shift of 20x
Fair Value:US$26.6927.9% undervalued
44 followersusers have followed this narrative
3 commentsusers have commented on this narrative
0 likesusers have liked this narrative
TI


TickerTickle on Oracle ·
The Quiet Giant That Became AI’s Power Grid
Fair Value:US$389.8148.6% undervalued
6 followersusers have followed this narrative
0 commentsusers have commented on this narrative
0 likesusers have liked this narrative
AU

AuCA on Nova Ljubljanska Banka d.d ·
Nova Ljubljanska Banka d.d will expect a 11.2% revenue boost driving future growth
Fair Value:€20916.3% undervalued
23 followersusers have followed this narrative
3 commentsusers have commented on this narrative
0 likesusers have liked this narrative
Popular Narratives
OS


oscargarcia on Alphabet ·
The company that turned a verb into a global necessity and basically runs the modern internet, digital ads, smartphones, maps, and AI.
Fair Value:US$3406.3% undervalued
131 followersusers have followed this narrative
6 commentsusers have commented on this narrative
17 likesusers have liked this narrative
TH

TheWallstreetKing on MicroVision ·
MicroVision will explode future revenue by 380.37% with a vision towards success
Fair Value:US$6098.4% undervalued
81 followersusers have followed this narrative
10 commentsusers have commented on this narrative
18 likesusers have liked this narrative
AN


AnalystConsensusTarget on NVIDIA ·
NVDA: Expanding AI Demand Will Drive Major Data Center Investments Through 2026
Fair Value:US$232.7921.6% undervalued
918 followersusers have followed this narrative
5 commentsusers have commented on this narrative
21 likesusers have liked this narrative