Stock Analysis
- South Korea
- /
- Medical Equipment
- /
- KOSDAQ:A048870
There's Been No Shortage Of Growth Recently For Synergy Innovation's (KOSDAQ:048870) Returns On Capital


To find a multi-bagger stock, what are the underlying trends we should look for in a business? In a perfect world, we'd like to see a company investing more capital into its business and ideally the returns earned from that capital are also increasing. If you see this, it typically means it's a company with a great business model and plenty of profitable reinvestment opportunities. So on that note, Synergy Innovation (KOSDAQ:048870) looks quite promising in regards to its trends of return on capital.
Understanding Return On Capital Employed (ROCE)
For those who don't know, ROCE is a measure of a company's yearly pre-tax profit (its return), relative to the capital employed in the business. The formula for this calculation on Synergy Innovation is:
Return on Capital Employed = Earnings Before Interest and Tax (EBIT) ÷ (Total Assets - Current Liabilities)
0.11 = ₩11b ÷ (₩158b - ₩52b) (Based on the trailing twelve months to December 2020).
Therefore, Synergy Innovation has an ROCE of 11%. In absolute terms, that's a pretty normal return, and it's somewhat close to the Medical Equipment industry average of 13%.
See our latest analysis for Synergy Innovation
While the past is not representative of the future, it can be helpful to know how a company has performed historically, which is why we have this chart above. If you want to delve into the historical earnings, revenue and cash flow of Synergy Innovation, check out these free graphs here.
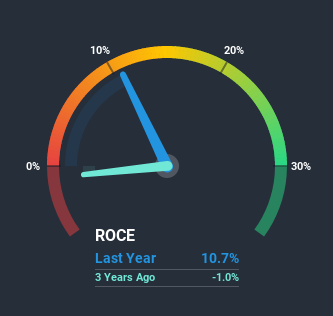
So How Is Synergy Innovation's ROCE Trending?
Synergy Innovation has recently broken into profitability so their prior investments seem to be paying off. The company was generating losses four years ago, but now it's earning 11% which is a sight for sore eyes. In addition to that, Synergy Innovation is employing 121% more capital than previously which is expected of a company that's trying to break into profitability. This can indicate that there's plenty of opportunities to invest capital internally and at ever higher rates, both common traits of a multi-bagger.
On a side note, we noticed that the improvement in ROCE appears to be partly fueled by an increase in current liabilities. Effectively this means that suppliers or short-term creditors are now funding 33% of the business, which is more than it was four years ago. It's worth keeping an eye on this because as the percentage of current liabilities to total assets increases, some aspects of risk also increase.
In Conclusion...
Long story short, we're delighted to see that Synergy Innovation's reinvestment activities have paid off and the company is now profitable. And since the stock has dived 71% over the last five years, there may be other factors affecting the company's prospects. Regardless, we think the underlying fundamentals warrant this stock for further investigation.
Like most companies, Synergy Innovation does come with some risks, and we've found 1 warning sign that you should be aware of.
While Synergy Innovation isn't earning the highest return, check out this free list of companies that are earning high returns on equity with solid balance sheets.
If you decide to trade Synergy Innovation, use the lowest-cost* platform that is rated #1 Overall by Barron’s, Interactive Brokers. Trade stocks, options, futures, forex, bonds and funds on 135 markets, all from a single integrated account. Promoted
Valuation is complex, but we're helping make it simple.
Find out whether Synergy Innovation is potentially over or undervalued by checking out our comprehensive analysis, which includes fair value estimates, risks and warnings, dividends, insider transactions and financial health.
View the Free AnalysisThis article by Simply Wall St is general in nature. It does not constitute a recommendation to buy or sell any stock, and does not take account of your objectives, or your financial situation. We aim to bring you long-term focused analysis driven by fundamental data. Note that our analysis may not factor in the latest price-sensitive company announcements or qualitative material. Simply Wall St has no position in any stocks mentioned.
*Interactive Brokers Rated Lowest Cost Broker by StockBrokers.com Annual Online Review 2020
Have feedback on this article? Concerned about the content? Get in touch with us directly. Alternatively, email editorial-team (at) simplywallst.com.
About KOSDAQ:A048870
Synergy Innovation
Engages in the research and development, and investment of generic and new drugs, medical devices, and health functional foods in South Korea.
Flawless balance sheet and fair value.
