
Advertisement

Today we will run through one way of estimating the intrinsic value of Silla Co.,Ltd (KRX:004970) by taking the forecast future cash flows of the company and discounting them back to today's value. Our analysis will employ the Discounted Cash Flow (DCF) model. Believe it or not, it's not too difficult to follow, as you'll see from our example!
Remember though, that there are many ways to estimate a company's value, and a DCF is just one method. Anyone interested in learning a bit more about intrinsic value should have a read of the Simply Wall St analysis model.
See our latest analysis for SillaLtd
Is SillaLtd fairly valued?
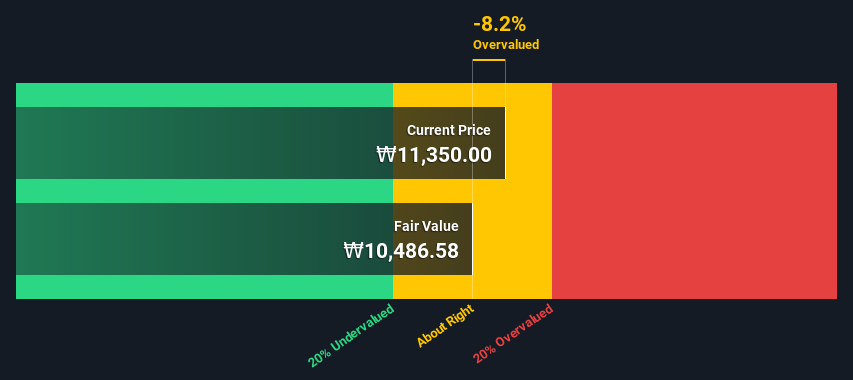
As SillaLtd operates in the food sector, we need to calculate the intrinsic value slightly differently. Instead of using free cash flows, which are hard to estimate and often not reported by analysts in this industry, dividends per share (DPS) payments are used. This often underestimates the value of a stock, but it can still be good as a comparison to competitors. The 'Gordon Growth Model' is used, which simply assumes that dividend payments will continue to increase at a sustainable growth rate forever. For a number of reasons a very conservative growth rate is used that cannot exceed that of a company's Gross Domestic Product (GDP). In this case we used the 5-year average of the 10-year government bond yield (3.7%). The expected dividend per share is then discounted to today's value at a cost of equity of 8.4%. Compared to the current share price of ₩11k, the company appears around fair value at the time of writing. Valuations are imprecise instruments though, rather like a telescope - move a few degrees and end up in a different galaxy. Do keep this in mind.
Value Per Share = Expected Dividend Per Share / (Discount Rate - Perpetual Growth Rate)
= ₩500 / (8.4% – 3.7%)
= ₩10k
Important assumptions
The calculation above is very dependent on two assumptions. The first is the discount rate and the other is the cash flows. If you don't agree with these result, have a go at the calculation yourself and play with the assumptions. The DCF also does not consider the possible cyclicality of an industry, or a company's future capital requirements, so it does not give a full picture of a company's potential performance. Given that we are looking at SillaLtd as potential shareholders, the cost of equity is used as the discount rate, rather than the cost of capital (or weighted average cost of capital, WACC) which accounts for debt. In this calculation we've used 8.4%, which is based on a levered beta of 0.800. Beta is a measure of a stock's volatility, compared to the market as a whole. We get our beta from the industry average beta of globally comparable companies, with an imposed limit between 0.8 and 2.0, which is a reasonable range for a stable business.
Next Steps:
Valuation is only one side of the coin in terms of building your investment thesis, and it shouldn't be the only metric you look at when researching a company. It's not possible to obtain a foolproof valuation with a DCF model. Rather it should be seen as a guide to "what assumptions need to be true for this stock to be under/overvalued?" For instance, if the terminal value growth rate is adjusted slightly, it can dramatically alter the overall result. For SillaLtd, we've put together three relevant items you should explore:
- Risks: You should be aware of the 3 warning signs for SillaLtd (1 is significant!) we've uncovered before considering an investment in the company.
- Other Solid Businesses: Low debt, high returns on equity and good past performance are fundamental to a strong business. Why not explore our interactive list of stocks with solid business fundamentals to see if there are other companies you may not have considered!
- Other Top Analyst Picks: Interested to see what the analysts are thinking? Take a look at our interactive list of analysts' top stock picks to find out what they feel might have an attractive future outlook!
PS. The Simply Wall St app conducts a discounted cash flow valuation for every stock on the KOSE every day. If you want to find the calculation for other stocks just search here.
When trading stocks or any other investment, use the platform considered by many to be the Professional's Gateway to the Worlds Market, Interactive Brokers. You get the lowest-cost* trading on stocks, options, futures, forex, bonds and funds worldwide from a single integrated account. Promoted
New: Manage All Your Stock Portfolios in One Place
We've created the ultimate portfolio companion for stock investors, and it's free.
• Connect an unlimited number of Portfolios and see your total in one currency
• Be alerted to new Warning Signs or Risks via email or mobile
• Track the Fair Value of your stocks
This article by Simply Wall St is general in nature. It does not constitute a recommendation to buy or sell any stock, and does not take account of your objectives, or your financial situation. We aim to bring you long-term focused analysis driven by fundamental data. Note that our analysis may not factor in the latest price-sensitive company announcements or qualitative material. Simply Wall St has no position in any stocks mentioned.
*Interactive Brokers Rated Lowest Cost Broker by StockBrokers.com Annual Online Review 2020
Have feedback on this article? Concerned about the content? Get in touch with us directly. Alternatively, email editorial-team (at) simplywallst.com.
About KOSE:A004970
Excellent balance sheet, good value and pays a dividend.
Market Insights


Advertisement
Community Narratives
Alphabet: The Under-appreciated Compounder Hiding in Plain Sight
Fair Value US$282.83|30.8% undervalued
BL
Community Contributor
Planet Labs: At The Heart Of The Emerging New Space Boom
Fair Value US$11.31|42.2% undervalued
AN
Community Contributor
Exxon in Guyana 5 year forecast Low $135 to High $189
Fair Value US$174.00|38.3% undervalued
AG
Community Contributor