
Advertisement
- South Korea
- /
- Oil and Gas
- /
- KOSE:A096770
SK Innovation Co., Ltd. (KRX:096770) Might Not Be As Mispriced As It Looks After Plunging 32%
SK Innovation Co., Ltd. (KRX:096770) shareholders that were waiting for something to happen have been dealt a blow with a 32% share price drop in the last month. The drop over the last 30 days has capped off a tough year for shareholders, with the share price down 21% in that time.
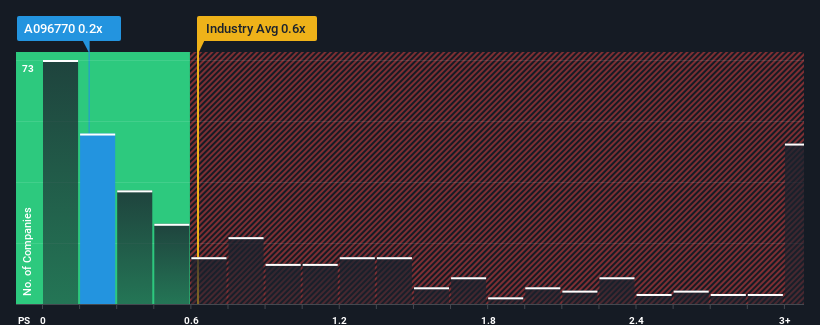
Even after such a large drop in price, it's still not a stretch to say that SK Innovation's price-to-sales (or "P/S") ratio of 0.2x right now seems quite "middle-of-the-road" compared to the Oil and Gas industry in Korea, where the median P/S ratio is around 0.3x. Although, it's not wise to simply ignore the P/S without explanation as investors may be disregarding a distinct opportunity or a costly mistake.
See our latest analysis for SK Innovation
How SK Innovation Has Been Performing
SK Innovation hasn't been tracking well recently as its declining revenue compares poorly to other companies, which have seen some growth in their revenues on average. One possibility is that the P/S ratio is moderate because investors think this poor revenue performance will turn around. You'd really hope so, otherwise you're paying a relatively elevated price for a company with this sort of growth profile.
Keen to find out how analysts think SK Innovation's future stacks up against the industry? In that case, our free report is a great place to start .What Are Revenue Growth Metrics Telling Us About The P/S?
There's an inherent assumption that a company should be matching the industry for P/S ratios like SK Innovation's to be considered reasonable.
Taking a look back first, the company's revenue growth last year wasn't something to get excited about as it posted a disappointing decline of 3.3%. Even so, admirably revenue has lifted 59% in aggregate from three years ago, notwithstanding the last 12 months. Accordingly, while they would have preferred to keep the run going, shareholders would definitely welcome the medium-term rates of revenue growth.
Turning to the outlook, the next three years should demonstrate the company's robustness, generating growth of 5.8% per year as estimated by the analysts watching the company. With the rest of the industry predicted to shrink by 0.8% per annum, that would be a fantastic result.
In light of this, it's peculiar that SK Innovation's P/S sits in-line with the majority of other companies. Apparently some shareholders are skeptical of the contrarian forecasts and have been accepting lower selling prices.
The Key Takeaway
Following SK Innovation's share price tumble, its P/S is just clinging on to the industry median P/S. Using the price-to-sales ratio alone to determine if you should sell your stock isn't sensible, however it can be a practical guide to the company's future prospects.
We've established that SK Innovation currently trades on a lower than expected P/S since its growth forecasts are potentially beating a struggling industry. We assume that investors are attributing some risk to the company's future revenues, keeping it from trading at a higher P/S. Perhaps there is some hesitation about the company's ability to keep swimming against the current of the broader industry turmoil. At least the risk of a price drop looks to be subdued, but investors seem to think future revenue could see some volatility.
You always need to take note of risks, for example - SK Innovation has 3 warning signs we think you should be aware of.
Of course, profitable companies with a history of great earnings growth are generally safer bets. So you may wish to see this free collection of other companies that have reasonable P/E ratios and have grown earnings strongly.
New: Manage All Your Stock Portfolios in One Place
We've created the ultimate portfolio companion for stock investors, and it's free.
• Connect an unlimited number of Portfolios and see your total in one currency
• Be alerted to new Warning Signs or Risks via email or mobile
• Track the Fair Value of your stocks
Have feedback on this article? Concerned about the content? Get in touch with us directly. Alternatively, email editorial-team (at) simplywallst.com.
This article by Simply Wall St is general in nature. We provide commentary based on historical data and analyst forecasts only using an unbiased methodology and our articles are not intended to be financial advice. It does not constitute a recommendation to buy or sell any stock, and does not take account of your objectives, or your financial situation. We aim to bring you long-term focused analysis driven by fundamental data. Note that our analysis may not factor in the latest price-sensitive company announcements or qualitative material. Simply Wall St has no position in any stocks mentioned.
About KOSE:A096770
SK Innovation
Engages in the production and sale of petroleum products, lubricants, and base oil in South Korea and internationally.
Good value slight.
Similar Companies
Market Insights


Advertisement
Community Narratives
MicroStrategy: Volatile Gamble or Golden Opportunity?
Fair Value US$663.00|33.3% undervalued
BL
Community Contributor
Emerging Markets and Debt Reduction Will Propel Bath & Body Works Forward
Fair Value US$40.73|23.4% undervalued
ZW
Community Contributor
An amazing opportunity to potentially get a 100 bagger
Fair Value US$10.00|8.5% overvalued
DA
Community Contributor