
Advertisement

Warren Buffett famously said, 'Volatility is far from synonymous with risk.' It's only natural to consider a company's balance sheet when you examine how risky it is, since debt is often involved when a business collapses. We can see that JS Corporation (KRX:194370) does use debt in its business. But should shareholders be worried about its use of debt?
What Risk Does Debt Bring?
Generally speaking, debt only becomes a real problem when a company can't easily pay it off, either by raising capital or with its own cash flow. Part and parcel of capitalism is the process of 'creative destruction' where failed businesses are mercilessly liquidated by their bankers. However, a more common (but still painful) scenario is that it has to raise new equity capital at a low price, thus permanently diluting shareholders. By replacing dilution, though, debt can be an extremely good tool for businesses that need capital to invest in growth at high rates of return. The first step when considering a company's debt levels is to consider its cash and debt together.
See our latest analysis for JS
What Is JS's Debt?
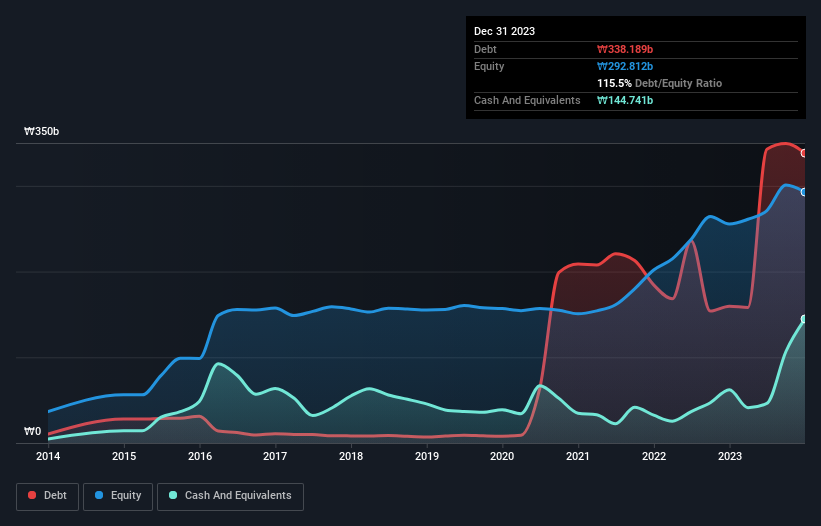
You can click the graphic below for the historical numbers, but it shows that as of December 2023 JS had ₩338.2b of debt, an increase on ₩159.6b, over one year. However, because it has a cash reserve of ₩144.7b, its net debt is less, at about ₩193.4b.
How Healthy Is JS' Balance Sheet?
According to the last reported balance sheet, JS had liabilities of ₩277.1b due within 12 months, and liabilities of ₩193.0b due beyond 12 months. On the other hand, it had cash of ₩144.7b and ₩195.4b worth of receivables due within a year. So it has liabilities totalling ₩129.9b more than its cash and near-term receivables, combined.
This deficit isn't so bad because JS is worth ₩217.9b, and thus could probably raise enough capital to shore up its balance sheet, if the need arose. But it's clear that we should definitely closely examine whether it can manage its debt without dilution.
We use two main ratios to inform us about debt levels relative to earnings. The first is net debt divided by earnings before interest, tax, depreciation, and amortization (EBITDA), while the second is how many times its earnings before interest and tax (EBIT) covers its interest expense (or its interest cover, for short). The advantage of this approach is that we take into account both the absolute quantum of debt (with net debt to EBITDA) and the actual interest expenses associated with that debt (with its interest cover ratio).
We'd say that JS's moderate net debt to EBITDA ratio ( being 1.9), indicates prudence when it comes to debt. And its commanding EBIT of 11.5 times its interest expense, implies the debt load is as light as a peacock feather. We saw JS grow its EBIT by 3.2% in the last twelve months. Whilst that hardly knocks our socks off it is a positive when it comes to debt. There's no doubt that we learn most about debt from the balance sheet. But it is future earnings, more than anything, that will determine JS's ability to maintain a healthy balance sheet going forward. So if you're focused on the future you can check out this free report showing analyst profit forecasts.
Finally, a business needs free cash flow to pay off debt; accounting profits just don't cut it. So we clearly need to look at whether that EBIT is leading to corresponding free cash flow. Over the most recent three years, JS recorded free cash flow worth 60% of its EBIT, which is around normal, given free cash flow excludes interest and tax. This cold hard cash means it can reduce its debt when it wants to.
Our View
When it comes to the balance sheet, the standout positive for JS was the fact that it seems able to cover its interest expense with its EBIT confidently. But the other factors we noted above weren't so encouraging. For instance it seems like it has to struggle a bit to handle its total liabilities. Considering this range of data points, we think JS is in a good position to manage its debt levels. But a word of caution: we think debt levels are high enough to justify ongoing monitoring. When analysing debt levels, the balance sheet is the obvious place to start. But ultimately, every company can contain risks that exist outside of the balance sheet. For instance, we've identified 2 warning signs for JS that you should be aware of.
If you're interested in investing in businesses that can grow profits without the burden of debt, then check out this free list of growing businesses that have net cash on the balance sheet.
New: Manage All Your Stock Portfolios in One Place
We've created the ultimate portfolio companion for stock investors, and it's free.
• Connect an unlimited number of Portfolios and see your total in one currency
• Be alerted to new Warning Signs or Risks via email or mobile
• Track the Fair Value of your stocks
Have feedback on this article? Concerned about the content? Get in touch with us directly. Alternatively, email editorial-team (at) simplywallst.com.
This article by Simply Wall St is general in nature. We provide commentary based on historical data and analyst forecasts only using an unbiased methodology and our articles are not intended to be financial advice. It does not constitute a recommendation to buy or sell any stock, and does not take account of your objectives, or your financial situation. We aim to bring you long-term focused analysis driven by fundamental data. Note that our analysis may not factor in the latest price-sensitive company announcements or qualitative material. Simply Wall St has no position in any stocks mentioned.
About KOSE:A194370
Slight second-rate dividend payer.
Similar Companies
Market Insights


Advertisement
Community Narratives
A Quality Compounder Marked Down on Overblown Fears
Fair Value US$120.72|60.9% undervalued
BA
Community Contributor

Wyndham Continues Global Expansion with 19% Ancillary Revenue Growth
Fair Value US$105.80|19.7% undervalued
ZW
Community Contributor