
Advertisement
- South Korea
- /
- Consumer Durables
- /
- KOSE:A192400
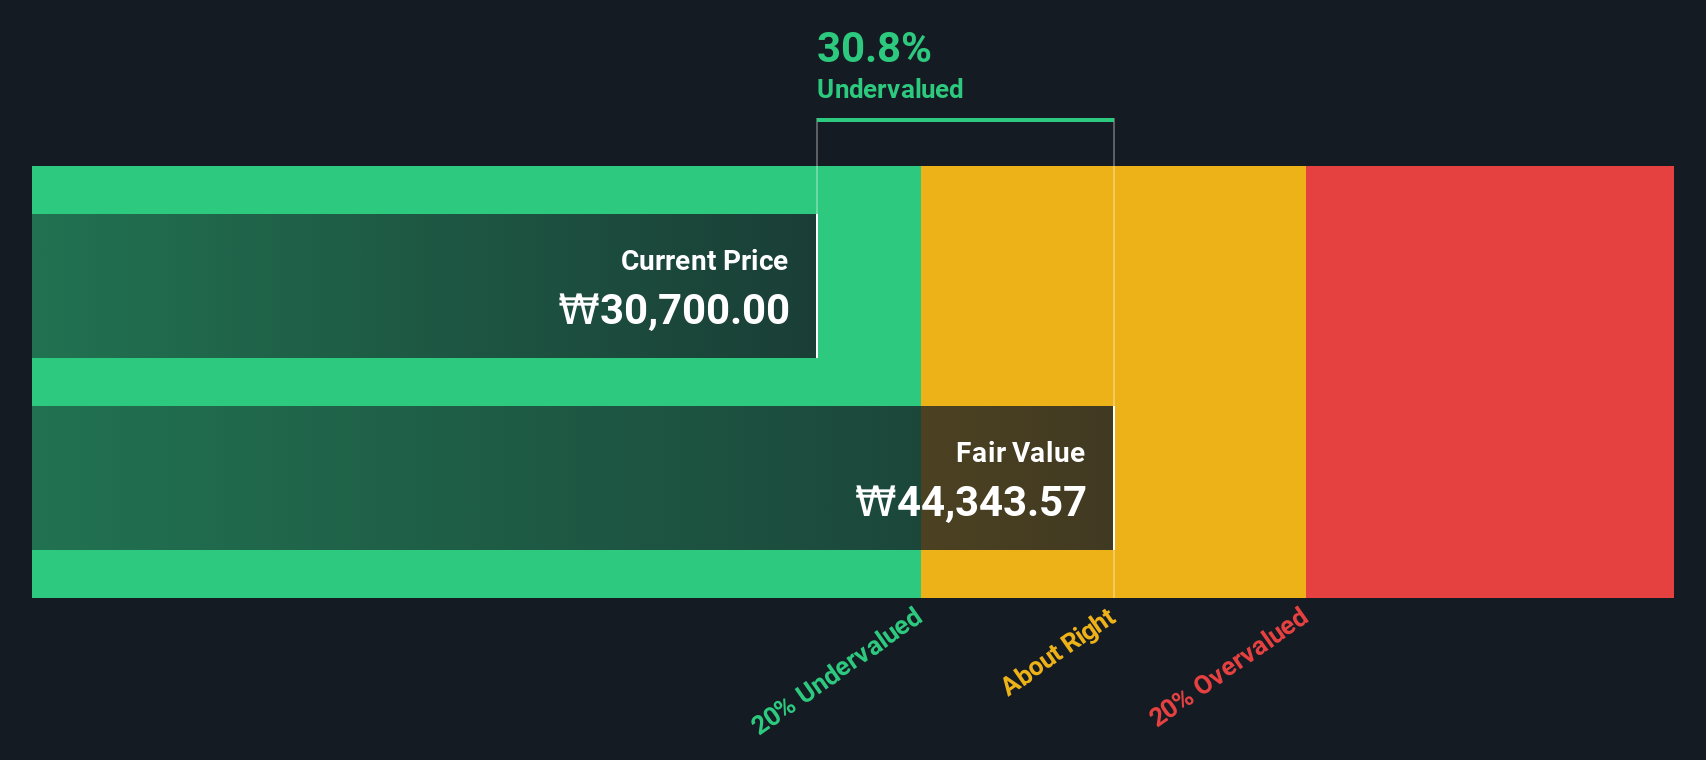
Cuckoo Holdings Co., Ltd. (KRX:192400) Shares Could Be 31% Below Their Intrinsic Value Estimate
Key Insights
- The projected fair value for Cuckoo Holdings is ₩44,344 based on 2 Stage Free Cash Flow to Equity
- Cuckoo Holdings' ₩30,700 share price signals that it might be 31% undervalued
- Peers of Cuckoo Holdings are currently trading on average at a 163% premium
Does the September share price for Cuckoo Holdings Co., Ltd. (KRX:192400) reflect what it's really worth? Today, we will estimate the stock's intrinsic value by estimating the company's future cash flows and discounting them to their present value. We will take advantage of the Discounted Cash Flow (DCF) model for this purpose. Don't get put off by the jargon, the math behind it is actually quite straightforward.
We would caution that there are many ways of valuing a company and, like the DCF, each technique has advantages and disadvantages in certain scenarios. If you want to learn more about discounted cash flow, the rationale behind this calculation can be read in detail in the Simply Wall St analysis model.
Is Cuckoo Holdings Fairly Valued?
We use what is known as a 2-stage model, which simply means we have two different periods of growth rates for the company's cash flows. Generally the first stage is higher growth, and the second stage is a lower growth phase. In the first stage we need to estimate the cash flows to the business over the next ten years. Where possible we use analyst estimates, but when these aren't available we extrapolate the previous free cash flow (FCF) from the last estimate or reported value. We assume companies with shrinking free cash flow will slow their rate of shrinkage, and that companies with growing free cash flow will see their growth rate slow, over this period. We do this to reflect that growth tends to slow more in the early years than it does in later years.
A DCF is all about the idea that a dollar in the future is less valuable than a dollar today, and so the sum of these future cash flows is then discounted to today's value:
10-year free cash flow (FCF) forecast
| 2026 | 2027 | 2028 | 2029 | 2030 | 2031 | 2032 | 2033 | 2034 | 2035 | |
| Levered FCF (₩, Millions) | ₩58.0b | ₩66.0b | ₩72.1b | ₩77.3b | ₩81.9b | ₩86.1b | ₩89.8b | ₩93.4b | ₩96.8b | ₩100.0b |
| Growth Rate Estimate Source | Analyst x1 | Analyst x1 | Est @ 9.18% | Est @ 7.29% | Est @ 5.97% | Est @ 5.04% | Est @ 4.39% | Est @ 3.94% | Est @ 3.62% | Est @ 3.40% |
| Present Value (₩, Millions) Discounted @ 8.3% | ₩53.6k | ₩56.3k | ₩56.7k | ₩56.2k | ₩55.0k | ₩53.3k | ₩51.4k | ₩49.3k | ₩47.2k | ₩45.0k |
("Est" = FCF growth rate estimated by Simply Wall St)
Present Value of 10-year Cash Flow (PVCF) = ₩524b
We now need to calculate the Terminal Value, which accounts for all the future cash flows after this ten year period. For a number of reasons a very conservative growth rate is used that cannot exceed that of a country's GDP growth. In this case we have used the 5-year average of the 10-year government bond yield (2.9%) to estimate future growth. In the same way as with the 10-year 'growth' period, we discount future cash flows to today's value, using a cost of equity of 8.3%.
Terminal Value (TV)= FCF2035 × (1 + g) ÷ (r – g) = ₩100b× (1 + 2.9%) ÷ (8.3%– 2.9%) = ₩1.9t
Present Value of Terminal Value (PVTV)= TV / (1 + r)10= ₩1.9t÷ ( 1 + 8.3%)10= ₩854b
The total value, or equity value, is then the sum of the present value of the future cash flows, which in this case is ₩1.4t. In the final step we divide the equity value by the number of shares outstanding. Relative to the current share price of ₩31k, the company appears quite undervalued at a 31% discount to where the stock price trades currently. Remember though, that this is just an approximate valuation, and like any complex formula - garbage in, garbage out.
Important Assumptions
The calculation above is very dependent on two assumptions. The first is the discount rate and the other is the cash flows. If you don't agree with these result, have a go at the calculation yourself and play with the assumptions. The DCF also does not consider the possible cyclicality of an industry, or a company's future capital requirements, so it does not give a full picture of a company's potential performance. Given that we are looking at Cuckoo Holdings as potential shareholders, the cost of equity is used as the discount rate, rather than the cost of capital (or weighted average cost of capital, WACC) which accounts for debt. In this calculation we've used 8.3%, which is based on a levered beta of 1.098. Beta is a measure of a stock's volatility, compared to the market as a whole. We get our beta from the industry average beta of globally comparable companies, with an imposed limit between 0.8 and 2.0, which is a reasonable range for a stable business.
See our latest analysis for Cuckoo Holdings
SWOT Analysis for Cuckoo Holdings
Strength
- Currently debt free.
- Dividend is in the top 25% of dividend payers in the market.
Weakness
- Earnings declined over the past year.
Opportunity
- Annual revenue is forecast to grow faster than the South Korean market.
- Trading below our estimate of fair value by more than 20%.
Threat
- Dividends are not covered by cash flow.
Looking Ahead:
Valuation is only one side of the coin in terms of building your investment thesis, and it is only one of many factors that you need to assess for a company. The DCF model is not a perfect stock valuation tool. Rather it should be seen as a guide to "what assumptions need to be true for this stock to be under/overvalued?" For instance, if the terminal value growth rate is adjusted slightly, it can dramatically alter the overall result. What is the reason for the share price sitting below the intrinsic value? For Cuckoo Holdings, we've compiled three essential aspects you should further research:
- Risks: For instance, we've identified 1 warning sign for Cuckoo Holdings that you should be aware of.
- Future Earnings: How does A192400's growth rate compare to its peers and the wider market? Dig deeper into the analyst consensus number for the upcoming years by interacting with our free analyst growth expectation chart.
- Other High Quality Alternatives: Do you like a good all-rounder? Explore our interactive list of high quality stocks to get an idea of what else is out there you may be missing!
PS. The Simply Wall St app conducts a discounted cash flow valuation for every stock on the KOSE every day. If you want to find the calculation for other stocks just search here.
New: AI Stock Screener & Alerts
Our new AI Stock Screener scans the market every day to uncover opportunities.
• Dividend Powerhouses (3%+ Yield)
• Undervalued Small Caps with Insider Buying
• High growth Tech and AI Companies
Or build your own from over 50 metrics.
Have feedback on this article? Concerned about the content? Get in touch with us directly. Alternatively, email editorial-team (at) simplywallst.com.
This article by Simply Wall St is general in nature. We provide commentary based on historical data and analyst forecasts only using an unbiased methodology and our articles are not intended to be financial advice. It does not constitute a recommendation to buy or sell any stock, and does not take account of your objectives, or your financial situation. We aim to bring you long-term focused analysis driven by fundamental data. Note that our analysis may not factor in the latest price-sensitive company announcements or qualitative material. Simply Wall St has no position in any stocks mentioned.
About KOSE:A192400
Cuckoo Holdings
Manufactures and sells electric heaters and daily necessities in South Korea and internationally.
Excellent balance sheet and good value.
Market Insights

Advertisement
Community Narratives
MicroVision will explode future revenue by 380.37% with a vision towards success
Fair Value US$60.00|98.4% undervalued
TH
Community Contributor
The Indispensable Artery for a New North American Economy
Fair Value CA$132.87|1.3% undervalued
TI
Community Contributor