
Advertisement
- South Korea
- /
- Consumer Durables
- /
- KOSDAQ:A407400
GGUMBI Inc.'s (KOSDAQ:407400) Stock Retreats 29% But Revenues Haven't Escaped The Attention Of Investors
GGUMBI Inc. (KOSDAQ:407400) shareholders won't be pleased to see that the share price has had a very rough month, dropping 29% and undoing the prior period's positive performance. Instead of being rewarded, shareholders who have already held through the last twelve months are now sitting on a 12% share price drop.
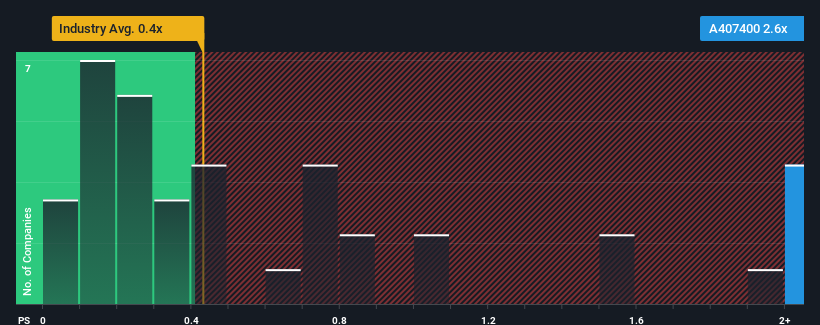
In spite of the heavy fall in price, when almost half of the companies in Korea's Consumer Durables industry have price-to-sales ratios (or "P/S") below 0.4x, you may still consider GGUMBI as a stock not worth researching with its 2.6x P/S ratio. However, the P/S might be quite high for a reason and it requires further investigation to determine if it's justified.
Our free stock report includes 3 warning signs investors should be aware of before investing in GGUMBI. Read for free now.Check out our latest analysis for GGUMBI
What Does GGUMBI's P/S Mean For Shareholders?
Recent times have been quite advantageous for GGUMBI as its revenue has been rising very briskly. Perhaps the market is expecting future revenue performance to outperform the wider market, which has seemingly got people interested in the stock. You'd really hope so, otherwise you're paying a pretty hefty price for no particular reason.
We don't have analyst forecasts, but you can see how recent trends are setting up the company for the future by checking out our free report on GGUMBI's earnings, revenue and cash flow.What Are Revenue Growth Metrics Telling Us About The High P/S?
There's an inherent assumption that a company should far outperform the industry for P/S ratios like GGUMBI's to be considered reasonable.
Retrospectively, the last year delivered an exceptional 37% gain to the company's top line. Pleasingly, revenue has also lifted 89% in aggregate from three years ago, thanks to the last 12 months of growth. Accordingly, shareholders would have definitely welcomed those medium-term rates of revenue growth.
Comparing that to the industry, which is only predicted to deliver 5.6% growth in the next 12 months, the company's momentum is stronger based on recent medium-term annualised revenue results.
With this in consideration, it's not hard to understand why GGUMBI's P/S is high relative to its industry peers. It seems most investors are expecting this strong growth to continue and are willing to pay more for the stock.
The Final Word
A significant share price dive has done very little to deflate GGUMBI's very lofty P/S. Typically, we'd caution against reading too much into price-to-sales ratios when settling on investment decisions, though it can reveal plenty about what other market participants think about the company.
As we suspected, our examination of GGUMBI revealed its three-year revenue trends are contributing to its high P/S, given they look better than current industry expectations. In the eyes of shareholders, the probability of a continued growth trajectory is great enough to prevent the P/S from pulling back. Barring any significant changes to the company's ability to make money, the share price should continue to be propped up.
Plus, you should also learn about these 3 warning signs we've spotted with GGUMBI (including 2 which are a bit unpleasant).
Of course, profitable companies with a history of great earnings growth are generally safer bets. So you may wish to see this free collection of other companies that have reasonable P/E ratios and have grown earnings strongly.
New: Manage All Your Stock Portfolios in One Place
We've created the ultimate portfolio companion for stock investors, and it's free.
• Connect an unlimited number of Portfolios and see your total in one currency
• Be alerted to new Warning Signs or Risks via email or mobile
• Track the Fair Value of your stocks
Have feedback on this article? Concerned about the content? Get in touch with us directly. Alternatively, email editorial-team (at) simplywallst.com.
This article by Simply Wall St is general in nature. We provide commentary based on historical data and analyst forecasts only using an unbiased methodology and our articles are not intended to be financial advice. It does not constitute a recommendation to buy or sell any stock, and does not take account of your objectives, or your financial situation. We aim to bring you long-term focused analysis driven by fundamental data. Note that our analysis may not factor in the latest price-sensitive company announcements or qualitative material. Simply Wall St has no position in any stocks mentioned.
About KOSDAQ:A407400
Excellent balance sheet with low risk.
Market Insights

Advertisement
Community Narratives
MINISO's fair value is projected at 26.69 with an anticipated PE ratio shift of 20x
Fair Value US$24.03|9.0% undervalued
BE
Community Contributor
Procter & Gamble: A Dividend Giant Facing Slowing Growth
Fair Value US$119.81|23.5% overvalued
AN
Community Contributor
Eli Lilly's Future Growth Driven by Tirzepatide and Favorable Market Conditions
Fair Value US$1.19k|14.4% undervalued
EA
Community Contributor