
Advertisement
- South Korea
- /
- Consumer Durables
- /
- KOSDAQ:A227100
It's Down 28% But H&B Design Co., Ltd. (KOSDAQ:227100) Could Be Riskier Than It Looks
To the annoyance of some shareholders, H&B Design Co., Ltd. (KOSDAQ:227100) shares are down a considerable 28% in the last month, which continues a horrid run for the company. For any long-term shareholders, the last month ends a year to forget by locking in a 61% share price decline.
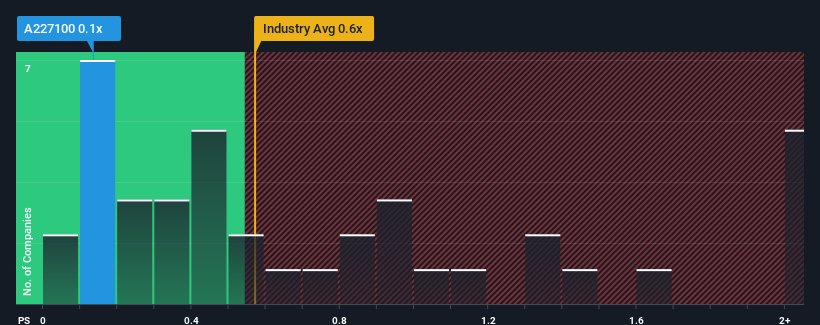
Even after such a large drop in price, you could still be forgiven for feeling indifferent about H&B Design's P/S ratio of 0.1x, since the median price-to-sales (or "P/S") ratio for the Consumer Durables industry in Korea is also close to 0.6x. Although, it's not wise to simply ignore the P/S without explanation as investors may be disregarding a distinct opportunity or a costly mistake.
See our latest analysis for H&B Design
What Does H&B Design's P/S Mean For Shareholders?
H&B Design certainly has been doing a great job lately as it's been growing its revenue at a really rapid pace. It might be that many expect the strong revenue performance to wane, which has kept the share price, and thus the P/S ratio, from rising. If that doesn't eventuate, then existing shareholders have reason to be feeling optimistic about the future direction of the share price.
We don't have analyst forecasts, but you can see how recent trends are setting up the company for the future by checking out our free report on H&B Design's earnings, revenue and cash flow.How Is H&B Design's Revenue Growth Trending?
In order to justify its P/S ratio, H&B Design would need to produce growth that's similar to the industry.
If we review the last year of revenue growth, we see the company's revenues grew exponentially. The amazing performance means it was also able to grow revenue by 287% in total over the last three years. So we can start by confirming that the company has done a great job of growing revenue over that time.
When compared to the industry's one-year growth forecast of 4.2%, the most recent medium-term revenue trajectory is noticeably more alluring
In light of this, it's curious that H&B Design's P/S sits in line with the majority of other companies. It may be that most investors are not convinced the company can maintain its recent growth rates.
The Key Takeaway
Following H&B Design's share price tumble, its P/S is just clinging on to the industry median P/S. Using the price-to-sales ratio alone to determine if you should sell your stock isn't sensible, however it can be a practical guide to the company's future prospects.
We didn't quite envision H&B Design's P/S sitting in line with the wider industry, considering the revenue growth over the last three-year is higher than the current industry outlook. It'd be fair to assume that potential risks the company faces could be the contributing factor to the lower than expected P/S. While recent revenue trends over the past medium-term suggest that the risk of a price decline is low, investors appear to see the likelihood of revenue fluctuations in the future.
Plus, you should also learn about these 4 warning signs we've spotted with H&B Design (including 2 which are a bit concerning).
Of course, profitable companies with a history of great earnings growth are generally safer bets. So you may wish to see this free collection of other companies that have reasonable P/E ratios and have grown earnings strongly.
Valuation is complex, but we're here to simplify it.
Discover if Quantumon might be undervalued or overvalued with our detailed analysis, featuring fair value estimates, potential risks, dividends, insider trades, and its financial condition.
Access Free AnalysisHave feedback on this article? Concerned about the content? Get in touch with us directly. Alternatively, email editorial-team (at) simplywallst.com.
This article by Simply Wall St is general in nature. We provide commentary based on historical data and analyst forecasts only using an unbiased methodology and our articles are not intended to be financial advice. It does not constitute a recommendation to buy or sell any stock, and does not take account of your objectives, or your financial situation. We aim to bring you long-term focused analysis driven by fundamental data. Note that our analysis may not factor in the latest price-sensitive company announcements or qualitative material. Simply Wall St has no position in any stocks mentioned.
About KOSDAQ:A227100
Quantumon
Researches, develops, produces, and sells portable auxiliary batteries and chargers for home and vehicle use.
Moderate and slightly overvalued.
Market Insights

Advertisement
Community Narratives
MINISO's fair value is projected at 26.69 with an anticipated PE ratio shift of 20x
Fair Value US$24.03|11.0% undervalued
BE
Community Contributor
Procter & Gamble: A Dividend Giant Facing Slowing Growth
Fair Value US$119.81|23.3% overvalued
AN
Community Contributor
Eli Lilly's Future Growth Driven by Tirzepatide and Favorable Market Conditions
Fair Value US$1.19k|13.8% undervalued
EA
Community Contributor