
Advertisement
- South Korea
- /
- Luxury
- /
- KOSDAQ:A001000
Silla TextileLtd (KOSDAQ:001000) May Have Issues Allocating Its Capital
Ignoring the stock price of a company, what are the underlying trends that tell us a business is past the growth phase? Businesses in decline often have two underlying trends, firstly, a declining return on capital employed (ROCE) and a declining base of capital employed. This combination can tell you that not only is the company investing less, it's earning less on what it does invest. So after we looked into Silla TextileLtd (KOSDAQ:001000), the trends above didn't look too great.
What Is Return On Capital Employed (ROCE)?
For those that aren't sure what ROCE is, it measures the amount of pre-tax profits a company can generate from the capital employed in its business. The formula for this calculation on Silla TextileLtd is:
Return on Capital Employed = Earnings Before Interest and Tax (EBIT) ÷ (Total Assets - Current Liabilities)
0.026 = ₩380m ÷ (₩31b - ₩16b) (Based on the trailing twelve months to March 2024).
Thus, Silla TextileLtd has an ROCE of 2.6%. In absolute terms, that's a low return and it also under-performs the Luxury industry average of 7.3%.
See our latest analysis for Silla TextileLtd
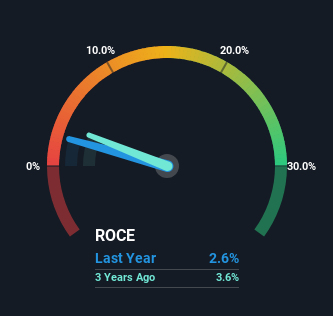
Historical performance is a great place to start when researching a stock so above you can see the gauge for Silla TextileLtd's ROCE against it's prior returns. If you'd like to look at how Silla TextileLtd has performed in the past in other metrics, you can view this free graph of Silla TextileLtd's past earnings, revenue and cash flow.
What Does the ROCE Trend For Silla TextileLtd Tell Us?
In terms of Silla TextileLtd's historical ROCE movements, the trend doesn't inspire confidence. To be more specific, the ROCE was 4.5% five years ago, but since then it has dropped noticeably. And on the capital employed front, the business is utilizing roughly the same amount of capital as it was back then. Since returns are falling and the business has the same amount of assets employed, this can suggest it's a mature business that hasn't had much growth in the last five years. So because these trends aren't typically conducive to creating a multi-bagger, we wouldn't hold our breath on Silla TextileLtd becoming one if things continue as they have.
On a separate but related note, it's important to know that Silla TextileLtd has a current liabilities to total assets ratio of 52%, which we'd consider pretty high. This can bring about some risks because the company is basically operating with a rather large reliance on its suppliers or other sorts of short-term creditors. While it's not necessarily a bad thing, it can be beneficial if this ratio is lower.
The Bottom Line On Silla TextileLtd's ROCE
In the end, the trend of lower returns on the same amount of capital isn't typically an indication that we're looking at a growth stock. Investors haven't taken kindly to these developments, since the stock has declined 46% from where it was five years ago. With underlying trends that aren't great in these areas, we'd consider looking elsewhere.
Silla TextileLtd does come with some risks though, we found 3 warning signs in our investment analysis, and 1 of those can't be ignored...
While Silla TextileLtd isn't earning the highest return, check out this free list of companies that are earning high returns on equity with solid balance sheets.
New: Manage All Your Stock Portfolios in One Place
We've created the ultimate portfolio companion for stock investors, and it's free.
• Connect an unlimited number of Portfolios and see your total in one currency
• Be alerted to new Warning Signs or Risks via email or mobile
• Track the Fair Value of your stocks
Have feedback on this article? Concerned about the content? Get in touch with us directly. Alternatively, email editorial-team (at) simplywallst.com.
This article by Simply Wall St is general in nature. We provide commentary based on historical data and analyst forecasts only using an unbiased methodology and our articles are not intended to be financial advice. It does not constitute a recommendation to buy or sell any stock, and does not take account of your objectives, or your financial situation. We aim to bring you long-term focused analysis driven by fundamental data. Note that our analysis may not factor in the latest price-sensitive company announcements or qualitative material. Simply Wall St has no position in any stocks mentioned.
Have feedback on this article? Concerned about the content? Get in touch with us directly. Alternatively, email editorial-team@simplywallst.com
About KOSDAQ:A001000
Silla TextileLtd
Engages in the manufacture and sale of polyester fabric in South Korea.
Adequate balance sheet low.
Market Insights


Advertisement
Community Narratives
MicroStrategy: Volatile Gamble or Golden Opportunity?
Fair Value US$663.00|31.9% undervalued
BL
Community Contributor
Emerging Markets and Debt Reduction Will Propel Bath & Body Works Forward
Fair Value US$40.73|22.1% undervalued
ZW
Community Contributor
An amazing opportunity to potentially get a 100 bagger
Fair Value US$10.00|36.0% overvalued
DA
Community Contributor