
Advertisement
- South Korea
- /
- Professional Services
- /
- KOSDAQ:A950140
Englewood Lab, Inc.'s (KOSDAQ:950140) Stock Has Been Sliding But Fundamentals Look Strong: Is The Market Wrong?
With its stock down 49% over the past three months, it is easy to disregard Englewood Lab (KOSDAQ:950140). However, a closer look at its sound financials might cause you to think again. Given that fundamentals usually drive long-term market outcomes, the company is worth looking at. In this article, we decided to focus on Englewood Lab's ROE.
Return on Equity or ROE is a test of how effectively a company is growing its value and managing investors’ money. In simpler terms, it measures the profitability of a company in relation to shareholder's equity.
View our latest analysis for Englewood Lab
How Do You Calculate Return On Equity?
ROE can be calculated by using the formula:
Return on Equity = Net Profit (from continuing operations) ÷ Shareholders' Equity
So, based on the above formula, the ROE for Englewood Lab is:
17% = ₩22b ÷ ₩130b (Based on the trailing twelve months to June 2024).
The 'return' is the yearly profit. So, this means that for every ₩1 of its shareholder's investments, the company generates a profit of ₩0.17.
What Is The Relationship Between ROE And Earnings Growth?
So far, we've learned that ROE is a measure of a company's profitability. Depending on how much of these profits the company reinvests or "retains", and how effectively it does so, we are then able to assess a company’s earnings growth potential. Assuming everything else remains unchanged, the higher the ROE and profit retention, the higher the growth rate of a company compared to companies that don't necessarily bear these characteristics.
A Side By Side comparison of Englewood Lab's Earnings Growth And 17% ROE
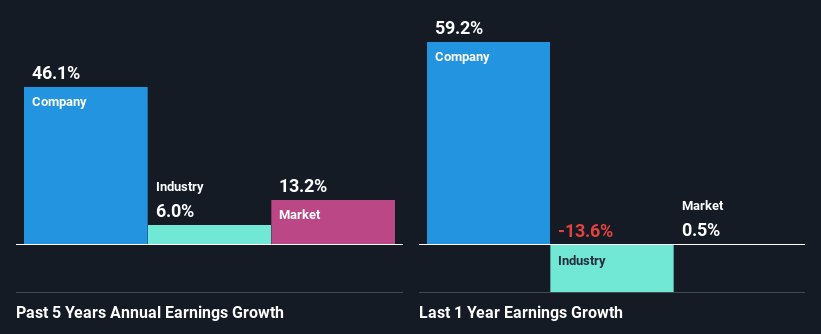
To start with, Englewood Lab's ROE looks acceptable. Especially when compared to the industry average of 11% the company's ROE looks pretty impressive. Probably as a result of this, Englewood Lab was able to see an impressive net income growth of 46% over the last five years. However, there could also be other causes behind this growth. Such as - high earnings retention or an efficient management in place.
We then compared Englewood Lab's net income growth with the industry and we're pleased to see that the company's growth figure is higher when compared with the industry which has a growth rate of 6.0% in the same 5-year period.
Earnings growth is a huge factor in stock valuation. It’s important for an investor to know whether the market has priced in the company's expected earnings growth (or decline). Doing so will help them establish if the stock's future looks promising or ominous. If you're wondering about Englewood Lab's's valuation, check out this gauge of its price-to-earnings ratio, as compared to its industry.
Is Englewood Lab Efficiently Re-investing Its Profits?
While the company did pay out a portion of its dividend in the past, it currently doesn't pay a regular dividend. This is likely what's driving the high earnings growth number discussed above.
Conclusion
Overall, we are quite pleased with Englewood Lab's performance. Specifically, we like that the company is reinvesting a huge chunk of its profits at a high rate of return. This of course has caused the company to see substantial growth in its earnings. If the company continues to grow its earnings the way it has, that could have a positive impact on its share price given how earnings per share influence long-term share prices. Not to forget, share price outcomes are also dependent on the potential risks a company may face. So it is important for investors to be aware of the risks involved in the business. To know the 1 risk we have identified for Englewood Lab visit our risks dashboard for free.
Valuation is complex, but we're here to simplify it.
Discover if Englewood Lab might be undervalued or overvalued with our detailed analysis, featuring fair value estimates, potential risks, dividends, insider trades, and its financial condition.
Access Free AnalysisHave feedback on this article? Concerned about the content? Get in touch with us directly. Alternatively, email editorial-team (at) simplywallst.com.
This article by Simply Wall St is general in nature. We provide commentary based on historical data and analyst forecasts only using an unbiased methodology and our articles are not intended to be financial advice. It does not constitute a recommendation to buy or sell any stock, and does not take account of your objectives, or your financial situation. We aim to bring you long-term focused analysis driven by fundamental data. Note that our analysis may not factor in the latest price-sensitive company announcements or qualitative material. Simply Wall St has no position in any stocks mentioned.
About KOSDAQ:A950140
Englewood Lab
Engages in the development, manufacture, marketing, sale, and distribution of cosmetic products in the United States, Canada, China, Korea, Europe, Southeast Asia, and internationally.
Flawless balance sheet with questionable track record.
Market Insights


Advertisement
Community Narratives
The Next Phase of Energy Storage: How NeoVolta Is Tackling America’s Power Crunch
Fair Value US$7.50|40.5% undervalued
MA
Community Contributor
Why EnSilica is Worth Possibly 13x its Current Price
Fair Value UK£5.00|91.8% undervalued
DO
Community Contributor
M&A Activity, Industry Diversification & A Defense Contract Monopoly Will Push BWXT For Healthy Long-Term Growth
Fair Value US$220.00|16.2% undervalued
CL
Community Contributor
A case for Cassiar Gold Corp (TSXV: GLDC) to reach CAD$8-10 before 2030 (X30-37)
Fair Value CA$10.00|97.5% undervalued
AG
Community Contributor