
Advertisement
- South Korea
- /
- Construction
- /
- KOSE:A375500
Here's What's Concerning About DL E&CLtd's (KRX:375500) Returns On Capital
If you're looking at a mature business that's past the growth phase, what are some of the underlying trends that pop up? Businesses in decline often have two underlying trends, firstly, a declining return on capital employed (ROCE) and a declining base of capital employed. This combination can tell you that not only is the company investing less, it's earning less on what it does invest. So after glancing at the trends within DL E&CLtd (KRX:375500), we weren't too hopeful.
Return On Capital Employed (ROCE): What Is It?
For those that aren't sure what ROCE is, it measures the amount of pre-tax profits a company can generate from the capital employed in its business. Analysts use this formula to calculate it for DL E&CLtd:
Return on Capital Employed = Earnings Before Interest and Tax (EBIT) ÷ (Total Assets - Current Liabilities)
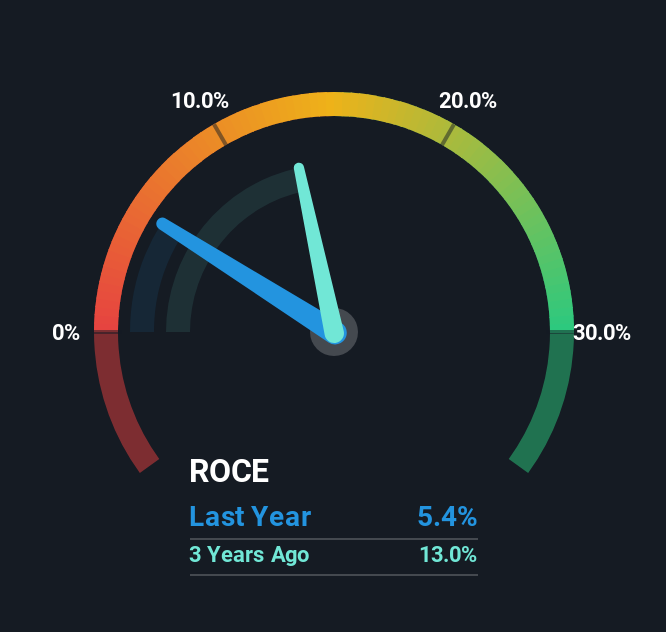
0.054 = ₩312b ÷ (₩9.8t - ₩4.0t) (Based on the trailing twelve months to June 2025).
Therefore, DL E&CLtd has an ROCE of 5.4%. In absolute terms, that's a low return but it's around the Construction industry average of 5.6%.
View our latest analysis for DL E&CLtd
In the above chart we have measured DL E&CLtd's prior ROCE against its prior performance, but the future is arguably more important. If you'd like, you can check out the forecasts from the analysts covering DL E&CLtd for free.
What Can We Tell From DL E&CLtd's ROCE Trend?
There is reason to be cautious about DL E&CLtd, given the returns are trending downwards. About three years ago, returns on capital were 13%, however they're now substantially lower than that as we saw above. And on the capital employed front, the business is utilizing roughly the same amount of capital as it was back then. This combination can be indicative of a mature business that still has areas to deploy capital, but the returns received aren't as high due potentially to new competition or smaller margins. So because these trends aren't typically conducive to creating a multi-bagger, we wouldn't hold our breath on DL E&CLtd becoming one if things continue as they have.
On a separate but related note, it's important to know that DL E&CLtd has a current liabilities to total assets ratio of 41%, which we'd consider pretty high. This can bring about some risks because the company is basically operating with a rather large reliance on its suppliers or other sorts of short-term creditors. While it's not necessarily a bad thing, it can be beneficial if this ratio is lower.
The Bottom Line On DL E&CLtd's ROCE
In summary, it's unfortunate that DL E&CLtd is generating lower returns from the same amount of capital. Investors must expect better things on the horizon though because the stock has risen 9.9% in the last three years. Regardless, we don't like the trends as they are and if they persist, we think you might find better investments elsewhere.
If you want to continue researching DL E&CLtd, you might be interested to know about the 1 warning sign that our analysis has discovered.
While DL E&CLtd isn't earning the highest return, check out this free list of companies that are earning high returns on equity with solid balance sheets.
New: Manage All Your Stock Portfolios in One Place
We've created the ultimate portfolio companion for stock investors, and it's free.
• Connect an unlimited number of Portfolios and see your total in one currency
• Be alerted to new Warning Signs or Risks via email or mobile
• Track the Fair Value of your stocks
Have feedback on this article? Concerned about the content? Get in touch with us directly. Alternatively, email editorial-team (at) simplywallst.com.
This article by Simply Wall St is general in nature. We provide commentary based on historical data and analyst forecasts only using an unbiased methodology and our articles are not intended to be financial advice. It does not constitute a recommendation to buy or sell any stock, and does not take account of your objectives, or your financial situation. We aim to bring you long-term focused analysis driven by fundamental data. Note that our analysis may not factor in the latest price-sensitive company announcements or qualitative material. Simply Wall St has no position in any stocks mentioned.
About KOSE:A375500
DL E&CLtd
A construction company, provides engineering, procurement, and construction solutions in South Korea.
Undervalued with proven track record.
Market Insights

Advertisement
Community Narratives
Finding The True Value Of A Logistics Powerhouse
Fair Value US$95.21|8.6% undervalued
NV
Community Contributor
Paradigm Biopharmaceuticals Will Lead Osteoarthritis Treatment with Zilosul's FDA Success
Fair Value AU$5.50|92.1% undervalued
AM
Community Contributor
Barrick Mining (ABX:CA): A Gold Hedge against a U.S. Shutdown
Fair Value CA$60.00|25.6% undervalued
GM
Community Contributor