
Advertisement

Howard Marks put it nicely when he said that, rather than worrying about share price volatility, 'The possibility of permanent loss is the risk I worry about... and every practical investor I know worries about.' So it might be obvious that you need to consider debt, when you think about how risky any given stock is, because too much debt can sink a company. We can see that SK IE Technology Co., Ltd. (KRX:361610) does use debt in its business. But the real question is whether this debt is making the company risky.
When Is Debt Dangerous?
Debt assists a business until the business has trouble paying it off, either with new capital or with free cash flow. In the worst case scenario, a company can go bankrupt if it cannot pay its creditors. While that is not too common, we often do see indebted companies permanently diluting shareholders because lenders force them to raise capital at a distressed price. By replacing dilution, though, debt can be an extremely good tool for businesses that need capital to invest in growth at high rates of return. When we examine debt levels, we first consider both cash and debt levels, together.
View our latest analysis for SK IE Technology
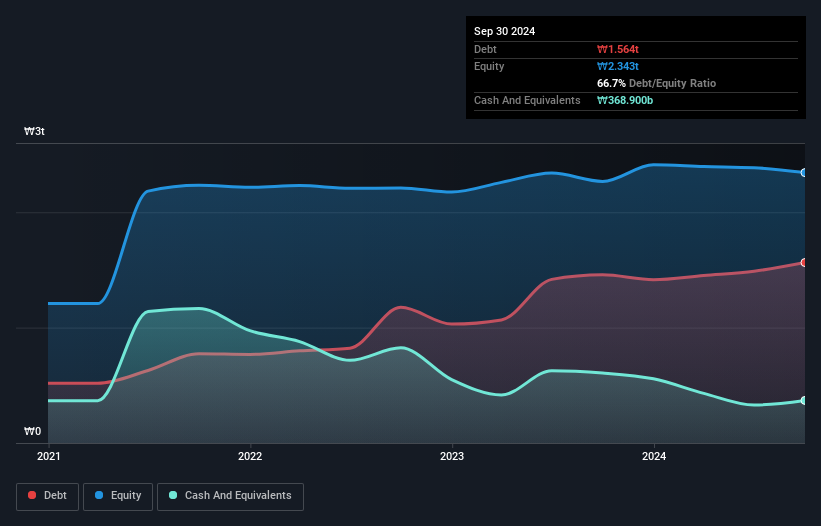
What Is SK IE Technology's Debt?
You can click the graphic below for the historical numbers, but it shows that as of September 2024 SK IE Technology had ₩1.56t of debt, an increase on ₩1.46t, over one year. On the flip side, it has ₩368.9b in cash leading to net debt of about ₩1.20t.
A Look At SK IE Technology's Liabilities
We can see from the most recent balance sheet that SK IE Technology had liabilities of ₩271.9b falling due within a year, and liabilities of ₩1.44t due beyond that. Offsetting these obligations, it had cash of ₩368.9b as well as receivables valued at ₩51.4b due within 12 months. So its liabilities outweigh the sum of its cash and (near-term) receivables by ₩1.29t.
This is a mountain of leverage relative to its market capitalization of ₩1.68t. This suggests shareholders would be heavily diluted if the company needed to shore up its balance sheet in a hurry. There's no doubt that we learn most about debt from the balance sheet. But it is future earnings, more than anything, that will determine SK IE Technology's ability to maintain a healthy balance sheet going forward. So if you're focused on the future you can check out this free report showing analyst profit forecasts.
Over 12 months, SK IE Technology made a loss at the EBIT level, and saw its revenue drop to ₩332b, which is a fall of 49%. To be frank that doesn't bode well.
Caveat Emptor
While SK IE Technology's falling revenue is about as heartwarming as a wet blanket, arguably its earnings before interest and tax (EBIT) loss is even less appealing. Indeed, it lost a very considerable ₩187b at the EBIT level. Considering that alongside the liabilities mentioned above does not give us much confidence that company should be using so much debt. So we think its balance sheet is a little strained, though not beyond repair. Another cause for caution is that is bled ₩362b in negative free cash flow over the last twelve months. So suffice it to say we consider the stock very risky. When analysing debt levels, the balance sheet is the obvious place to start. However, not all investment risk resides within the balance sheet - far from it. We've identified 1 warning sign with SK IE Technology , and understanding them should be part of your investment process.
If, after all that, you're more interested in a fast growing company with a rock-solid balance sheet, then check out our list of net cash growth stocks without delay.
New: Manage All Your Stock Portfolios in One Place
We've created the ultimate portfolio companion for stock investors, and it's free.
• Connect an unlimited number of Portfolios and see your total in one currency
• Be alerted to new Warning Signs or Risks via email or mobile
• Track the Fair Value of your stocks
Have feedback on this article? Concerned about the content? Get in touch with us directly. Alternatively, email editorial-team (at) simplywallst.com.
This article by Simply Wall St is general in nature. We provide commentary based on historical data and analyst forecasts only using an unbiased methodology and our articles are not intended to be financial advice. It does not constitute a recommendation to buy or sell any stock, and does not take account of your objectives, or your financial situation. We aim to bring you long-term focused analysis driven by fundamental data. Note that our analysis may not factor in the latest price-sensitive company announcements or qualitative material. Simply Wall St has no position in any stocks mentioned.
About KOSE:A361610
SK IE Technology
Engages in manufacturing and selling of battery materials in South Korea, Asia, and Europe.
High growth potential and slightly overvalued.
Market Insights


Advertisement
Community Narratives
A case for TSXV:USA to reach USD $5.00 - $9.00 (CAD $7.30–$12.29) by 2029.
Fair Value CA$12.29|91.2% undervalued
AG
Community Contributor
DLocal's Future Growth Fueled by 35% Revenue and Profit Margin Boosts
Fair Value US$195.39|94.1% undervalued
WY
Community Contributor
Historically Cheap, but the Margin of Safety Is Still Thin
Fair Value SEK 232.58|12.7% undervalued
MA
Community Contributor