
Advertisement
- South Korea
- /
- Machinery
- /
- KOSE:A145210
Dynamic Design Co., LTD.'s (KRX:145210) 25% Price Boost Is Out Of Tune With Revenues
Dynamic Design Co., LTD. (KRX:145210) shareholders have had their patience rewarded with a 25% share price jump in the last month. While recent buyers may be laughing, long-term holders might not be as pleased since the recent gain only brings the stock back to where it started a year ago.
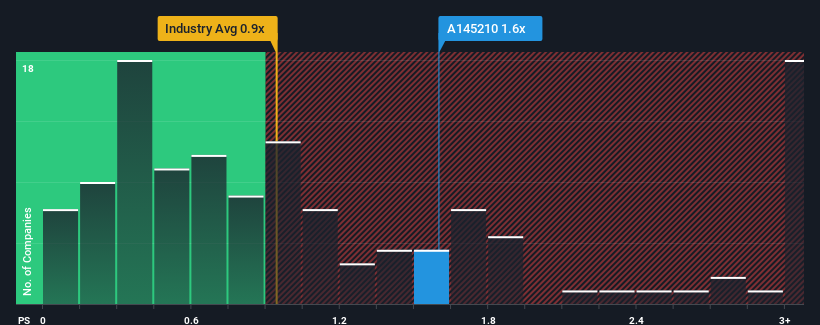
After such a large jump in price, given close to half the companies operating in Korea's Machinery industry have price-to-sales ratios (or "P/S") below 0.9x, you may consider Dynamic Design as a stock to potentially avoid with its 1.6x P/S ratio. Nonetheless, we'd need to dig a little deeper to determine if there is a rational basis for the elevated P/S.
Check out our latest analysis for Dynamic Design
How Has Dynamic Design Performed Recently?
Revenue has risen firmly for Dynamic Design recently, which is pleasing to see. Perhaps the market is expecting this decent revenue performance to beat out the industry over the near term, which has kept the P/S propped up. You'd really hope so, otherwise you're paying a pretty hefty price for no particular reason.
We don't have analyst forecasts, but you can see how recent trends are setting up the company for the future by checking out our free report on Dynamic Design's earnings, revenue and cash flow.Do Revenue Forecasts Match The High P/S Ratio?
Dynamic Design's P/S ratio would be typical for a company that's expected to deliver solid growth, and importantly, perform better than the industry.
Taking a look back first, we see that the company grew revenue by an impressive 15% last year. However, this wasn't enough as the latest three year period has seen the company endure a nasty 13% drop in revenue in aggregate. Therefore, it's fair to say the revenue growth recently has been undesirable for the company.
Comparing that to the industry, which is predicted to deliver 31% growth in the next 12 months, the company's downward momentum based on recent medium-term revenue results is a sobering picture.
In light of this, it's alarming that Dynamic Design's P/S sits above the majority of other companies. Apparently many investors in the company are way more bullish than recent times would indicate and aren't willing to let go of their stock at any price. Only the boldest would assume these prices are sustainable as a continuation of recent revenue trends is likely to weigh heavily on the share price eventually.
The Key Takeaway
Dynamic Design's P/S is on the rise since its shares have risen strongly. We'd say the price-to-sales ratio's power isn't primarily as a valuation instrument but rather to gauge current investor sentiment and future expectations.
Our examination of Dynamic Design revealed its shrinking revenue over the medium-term isn't resulting in a P/S as low as we expected, given the industry is set to grow. Right now we aren't comfortable with the high P/S as this revenue performance is highly unlikely to support such positive sentiment for long. Unless the the circumstances surrounding the recent medium-term improve, it wouldn't be wrong to expect a a difficult period ahead for the company's shareholders.
It's always necessary to consider the ever-present spectre of investment risk. We've identified 3 warning signs with Dynamic Design (at least 1 which is a bit unpleasant), and understanding these should be part of your investment process.
Of course, profitable companies with a history of great earnings growth are generally safer bets. So you may wish to see this free collection of other companies that have reasonable P/E ratios and have grown earnings strongly.
New: Manage All Your Stock Portfolios in One Place
We've created the ultimate portfolio companion for stock investors, and it's free.
• Connect an unlimited number of Portfolios and see your total in one currency
• Be alerted to new Warning Signs or Risks via email or mobile
• Track the Fair Value of your stocks
Have feedback on this article? Concerned about the content? Get in touch with us directly. Alternatively, email editorial-team (at) simplywallst.com.
This article by Simply Wall St is general in nature. We provide commentary based on historical data and analyst forecasts only using an unbiased methodology and our articles are not intended to be financial advice. It does not constitute a recommendation to buy or sell any stock, and does not take account of your objectives, or your financial situation. We aim to bring you long-term focused analysis driven by fundamental data. Note that our analysis may not factor in the latest price-sensitive company announcements or qualitative material. Simply Wall St has no position in any stocks mentioned.
About KOSE:A145210
Dynamic Design
Primarily engages in the manufacture and sale of tire molds forming machines in Korea, China, the Americas, Europe, and Indonesia.
Mediocre balance sheet with low risk.
Market Insights

Advertisement
Community Narratives
Finding The True Value Of A Logistics Powerhouse
Fair Value US$95.21|8.4% undervalued
NV
Community Contributor
Paradigm Biopharmaceuticals Will Lead Osteoarthritis Treatment with Zilosul's FDA Success
Fair Value AU$5.50|92.1% undervalued
AM
Community Contributor
Barrick Mining (ABX:CA): A Gold Hedge against a U.S. Shutdown
Fair Value CA$60.00|24.2% undervalued
GM
Community Contributor