
Advertisement
- South Korea
- /
- Electrical
- /
- KOSDAQ:A243840
There May Be Underlying Issues With The Quality Of Shin Heung Energy & ElectronicsLtd's (KOSDAQ:243840) Earnings
Unsurprisingly, Shin Heung Energy & Electronics Co.,Ltd.'s (KOSDAQ:243840) stock price was strong on the back of its healthy earnings report. We did some analysis and think that investors are missing some details hidden beneath the profit numbers.
Check out our latest analysis for Shin Heung Energy & ElectronicsLtd
Examining Cashflow Against Shin Heung Energy & ElectronicsLtd's Earnings
In high finance, the key ratio used to measure how well a company converts reported profits into free cash flow (FCF) is the accrual ratio (from cashflow). In plain english, this ratio subtracts FCF from net profit, and divides that number by the company's average operating assets over that period. You could think of the accrual ratio from cashflow as the 'non-FCF profit ratio'.
That means a negative accrual ratio is a good thing, because it shows that the company is bringing in more free cash flow than its profit would suggest. While it's not a problem to have a positive accrual ratio, indicating a certain level of non-cash profits, a high accrual ratio is arguably a bad thing, because it indicates paper profits are not matched by cash flow. Notably, there is some academic evidence that suggests that a high accrual ratio is a bad sign for near-term profits, generally speaking.
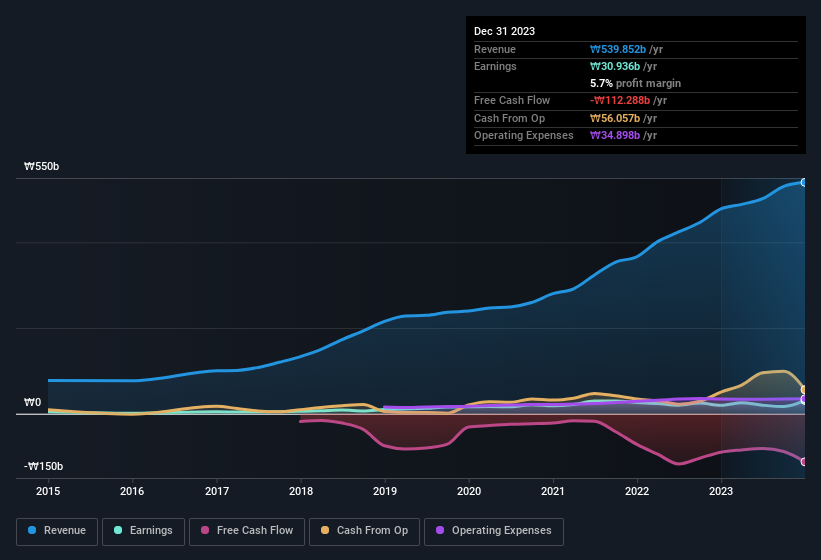
Shin Heung Energy & ElectronicsLtd has an accrual ratio of 0.26 for the year to December 2023. We can therefore deduce that its free cash flow fell well short of covering its statutory profit. In the last twelve months it actually had negative free cash flow, with an outflow of ₩112b despite its profit of ₩30.9b, mentioned above. Coming off the back of negative free cash flow last year, we imagine some shareholders might wonder if its cash burn of ₩112b, this year, indicates high risk.
That might leave you wondering what analysts are forecasting in terms of future profitability. Luckily, you can click here to see an interactive graph depicting future profitability, based on their estimates.
Our Take On Shin Heung Energy & ElectronicsLtd's Profit Performance
Shin Heung Energy & ElectronicsLtd's accrual ratio for the last twelve months signifies cash conversion is less than ideal, which is a negative when it comes to our view of its earnings. Because of this, we think that it may be that Shin Heung Energy & ElectronicsLtd's statutory profits are better than its underlying earnings power. Nonetheless, it's still worth noting that its earnings per share have grown at 45% over the last three years. Of course, we've only just scratched the surface when it comes to analysing its earnings; one could also consider margins, forecast growth, and return on investment, among other factors. Keep in mind, when it comes to analysing a stock it's worth noting the risks involved. Case in point: We've spotted 2 warning signs for Shin Heung Energy & ElectronicsLtd you should be aware of.
This note has only looked at a single factor that sheds light on the nature of Shin Heung Energy & ElectronicsLtd's profit. But there is always more to discover if you are capable of focussing your mind on minutiae. Some people consider a high return on equity to be a good sign of a quality business. So you may wish to see this free collection of companies boasting high return on equity, or this list of stocks that insiders are buying.
New: Manage All Your Stock Portfolios in One Place
We've created the ultimate portfolio companion for stock investors, and it's free.
• Connect an unlimited number of Portfolios and see your total in one currency
• Be alerted to new Warning Signs or Risks via email or mobile
• Track the Fair Value of your stocks
Have feedback on this article? Concerned about the content? Get in touch with us directly. Alternatively, email editorial-team (at) simplywallst.com.
This article by Simply Wall St is general in nature. We provide commentary based on historical data and analyst forecasts only using an unbiased methodology and our articles are not intended to be financial advice. It does not constitute a recommendation to buy or sell any stock, and does not take account of your objectives, or your financial situation. We aim to bring you long-term focused analysis driven by fundamental data. Note that our analysis may not factor in the latest price-sensitive company announcements or qualitative material. Simply Wall St has no position in any stocks mentioned.
About KOSDAQ:A243840
Shin Heung Energy & ElectronicsLtd
Engages in the manufacturing and sale of parts and facilities for the secondary battery markets in South Korea and internationally.
Fair value with low risk.
Market Insights

Advertisement
Community Narratives
MicroVision will explode future revenue by 380.37% with a vision towards success
Fair Value US$60.00|98.5% undervalued
TH
Community Contributor
The Indispensable Artery for a New North American Economy
Fair Value CA$132.87|2.3% undervalued
TI
Community Contributor