
Advertisement
- South Korea
- /
- Machinery
- /
- KOSDAQ:A240600
What Yujin Technology Co.,Ltd.'s (KOSDAQ:240600) 34% Share Price Gain Is Not Telling You
The Yujin Technology Co.,Ltd. (KOSDAQ:240600) share price has done very well over the last month, posting an excellent gain of 34%. Unfortunately, the gains of the last month did little to right the losses of the last year with the stock still down 23% over that time.
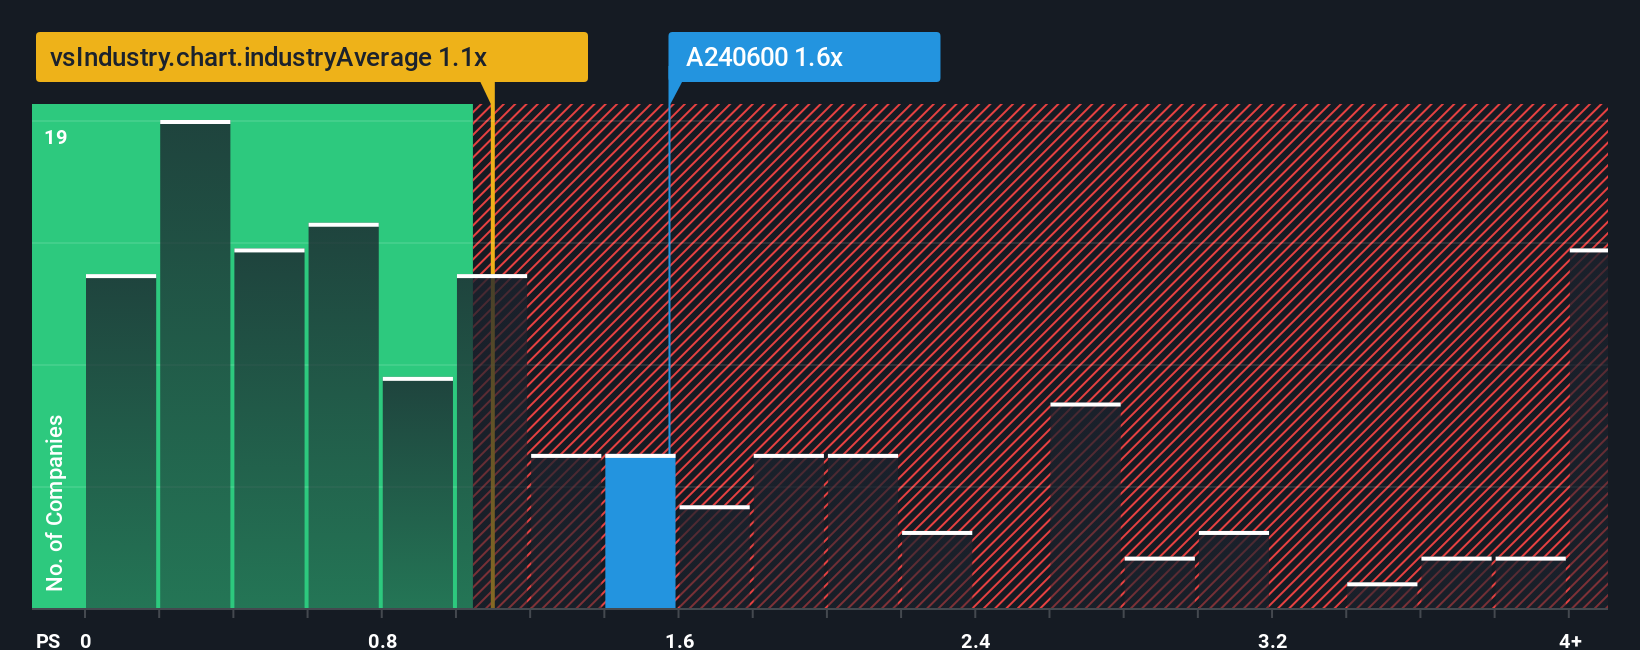
Even after such a large jump in price, it's still not a stretch to say that Yujin TechnologyLtd's price-to-sales (or "P/S") ratio of 1.6x right now seems quite "middle-of-the-road" compared to the Machinery industry in Korea, where the median P/S ratio is around 1.1x. However, investors might be overlooking a clear opportunity or potential setback if there is no rational basis for the P/S.
View our latest analysis for Yujin TechnologyLtd
What Does Yujin TechnologyLtd's Recent Performance Look Like?
As an illustration, revenue has deteriorated at Yujin TechnologyLtd over the last year, which is not ideal at all. It might be that many expect the company to put the disappointing revenue performance behind them over the coming period, which has kept the P/S from falling. If not, then existing shareholders may be a little nervous about the viability of the share price.
Although there are no analyst estimates available for Yujin TechnologyLtd, take a look at this free data-rich visualisation to see how the company stacks up on earnings, revenue and cash flow.How Is Yujin TechnologyLtd's Revenue Growth Trending?
Yujin TechnologyLtd's P/S ratio would be typical for a company that's only expected to deliver moderate growth, and importantly, perform in line with the industry.
Retrospectively, the last year delivered a frustrating 47% decrease to the company's top line. This means it has also seen a slide in revenue over the longer-term as revenue is down 20% in total over the last three years. Accordingly, shareholders would have felt downbeat about the medium-term rates of revenue growth.
Weighing that medium-term revenue trajectory against the broader industry's one-year forecast for expansion of 14% shows it's an unpleasant look.
With this information, we find it concerning that Yujin TechnologyLtd is trading at a fairly similar P/S compared to the industry. It seems most investors are ignoring the recent poor growth rate and are hoping for a turnaround in the company's business prospects. There's a good chance existing shareholders are setting themselves up for future disappointment if the P/S falls to levels more in line with the recent negative growth rates.
The Final Word
Yujin TechnologyLtd appears to be back in favour with a solid price jump bringing its P/S back in line with other companies in the industry Typically, we'd caution against reading too much into price-to-sales ratios when settling on investment decisions, though it can reveal plenty about what other market participants think about the company.
Our look at Yujin TechnologyLtd revealed its shrinking revenues over the medium-term haven't impacted the P/S as much as we anticipated, given the industry is set to grow. Even though it matches the industry, we're uncomfortable with the current P/S ratio, as this dismal revenue performance is unlikely to support a more positive sentiment for long. Unless the recent medium-term conditions improve markedly, investors will have a hard time accepting the share price as fair value.
And what about other risks? Every company has them, and we've spotted 3 warning signs for Yujin TechnologyLtd (of which 1 doesn't sit too well with us!) you should know about.
If strong companies turning a profit tickle your fancy, then you'll want to check out this free list of interesting companies that trade on a low P/E (but have proven they can grow earnings).
New: Manage All Your Stock Portfolios in One Place
We've created the ultimate portfolio companion for stock investors, and it's free.
• Connect an unlimited number of Portfolios and see your total in one currency
• Be alerted to new Warning Signs or Risks via email or mobile
• Track the Fair Value of your stocks
Have feedback on this article? Concerned about the content? Get in touch with us directly. Alternatively, email editorial-team (at) simplywallst.com.
This article by Simply Wall St is general in nature. We provide commentary based on historical data and analyst forecasts only using an unbiased methodology and our articles are not intended to be financial advice. It does not constitute a recommendation to buy or sell any stock, and does not take account of your objectives, or your financial situation. We aim to bring you long-term focused analysis driven by fundamental data. Note that our analysis may not factor in the latest price-sensitive company announcements or qualitative material. Simply Wall St has no position in any stocks mentioned.
About KOSDAQ:A240600
Yujin TechnologyLtd
Yujin Technology Co., Ltd. manufactures and supplies precision molds, processing machine parts, and automation equipment used in secondary battery manufacturing.
Excellent balance sheet with very low risk.
Market Insights

Advertisement
Community Narratives
MINISO's fair value is projected at 26.69 with an anticipated PE ratio shift of 20x
Fair Value US$24.03|11.0% undervalued
BE
Community Contributor
Procter & Gamble: A Dividend Giant Facing Slowing Growth
Fair Value US$119.81|23.3% overvalued
AN
Community Contributor
Eli Lilly's Future Growth Driven by Tirzepatide and Favorable Market Conditions
Fair Value US$1.19k|13.8% undervalued
EA
Community Contributor