
Advertisement
- South Korea
- /
- Machinery
- /
- KOSDAQ:A240600
Does Yujin TechnologyLtd (KOSDAQ:240600) Have A Healthy Balance Sheet?
Some say volatility, rather than debt, is the best way to think about risk as an investor, but Warren Buffett famously said that 'Volatility is far from synonymous with risk.' So it might be obvious that you need to consider debt, when you think about how risky any given stock is, because too much debt can sink a company. We note that Yujin Technology Co.,Ltd. (KOSDAQ:240600) does have debt on its balance sheet. But should shareholders be worried about its use of debt?
When Is Debt A Problem?
Debt is a tool to help businesses grow, but if a business is incapable of paying off its lenders, then it exists at their mercy. If things get really bad, the lenders can take control of the business. However, a more usual (but still expensive) situation is where a company must dilute shareholders at a cheap share price simply to get debt under control. Of course, the upside of debt is that it often represents cheap capital, especially when it replaces dilution in a company with the ability to reinvest at high rates of return. The first thing to do when considering how much debt a business uses is to look at its cash and debt together.
What Is Yujin TechnologyLtd's Debt?
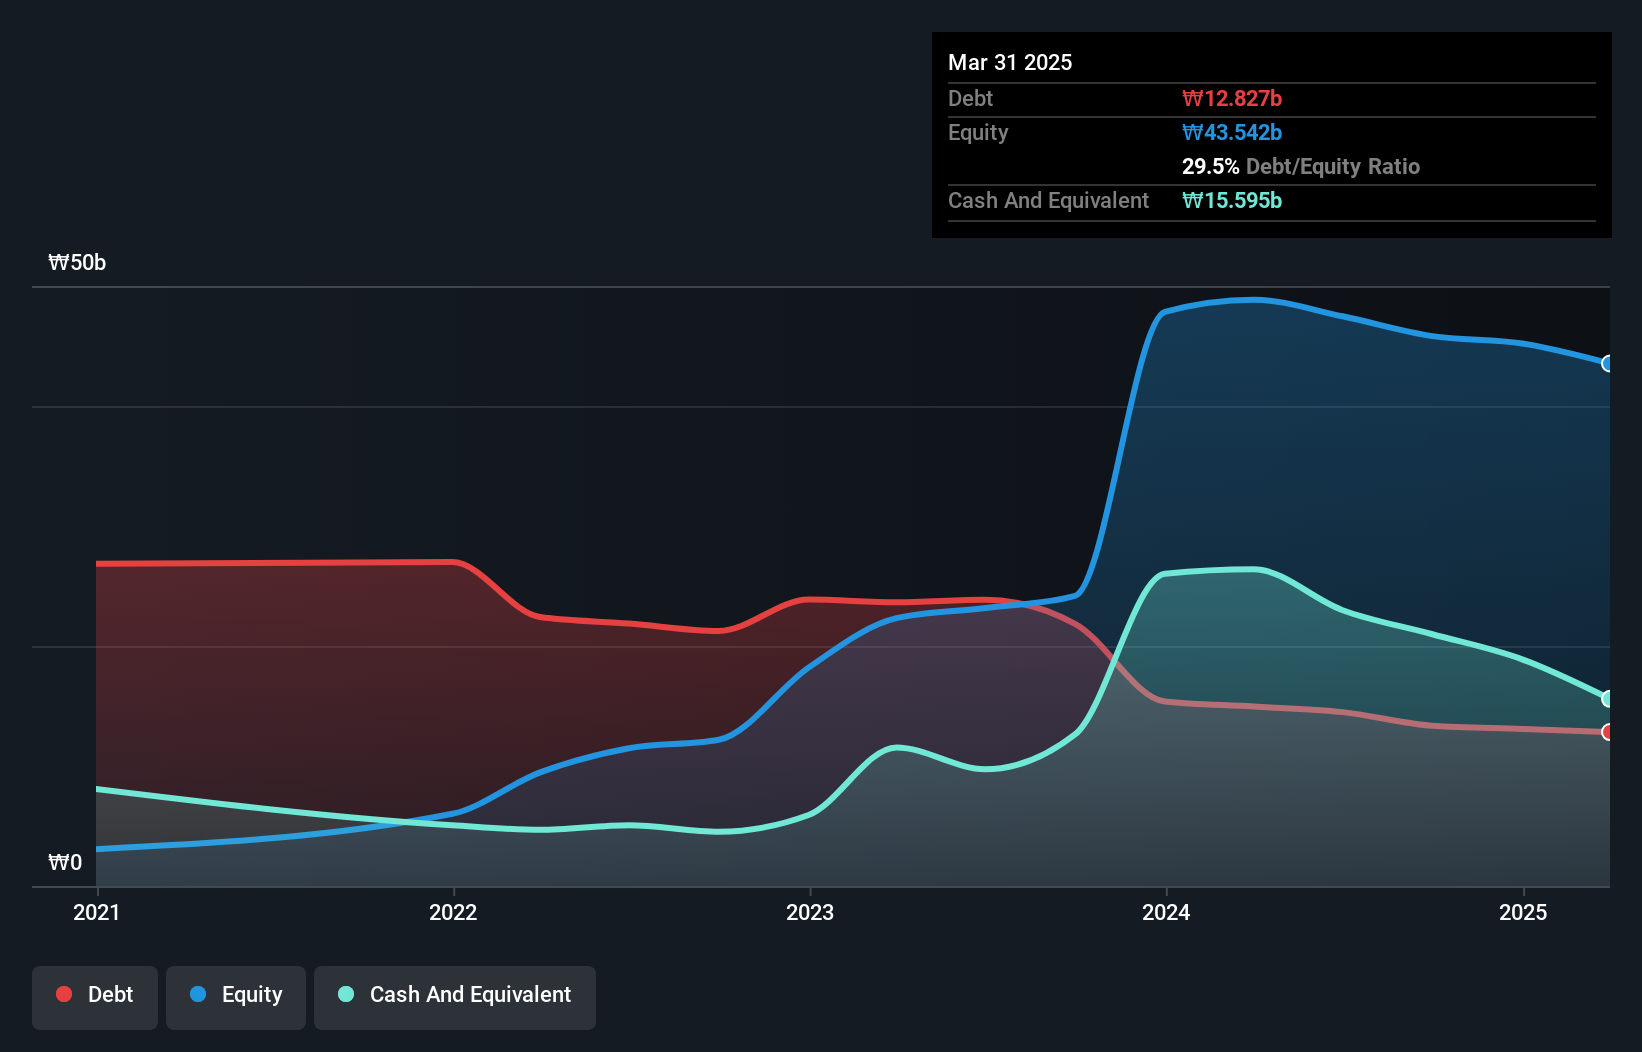
As you can see below, Yujin TechnologyLtd had ₩12.8b of debt at March 2025, down from ₩15.0b a year prior. But on the other hand it also has ₩15.6b in cash, leading to a ₩2.77b net cash position.
How Strong Is Yujin TechnologyLtd's Balance Sheet?
The latest balance sheet data shows that Yujin TechnologyLtd had liabilities of ₩16.4b due within a year, and liabilities of ₩2.77b falling due after that. Offsetting these obligations, it had cash of ₩15.6b as well as receivables valued at ₩6.95b due within 12 months. So it can boast ₩3.37b more liquid assets than total liabilities.
This surplus suggests that Yujin TechnologyLtd has a conservative balance sheet, and could probably eliminate its debt without much difficulty. Succinctly put, Yujin TechnologyLtd boasts net cash, so it's fair to say it does not have a heavy debt load! The balance sheet is clearly the area to focus on when you are analysing debt. But you can't view debt in total isolation; since Yujin TechnologyLtd will need earnings to service that debt. So if you're keen to discover more about its earnings, it might be worth checking out this graph of its long term earnings trend.
See our latest analysis for Yujin TechnologyLtd
In the last year Yujin TechnologyLtd had a loss before interest and tax, and actually shrunk its revenue by 47%, to ₩24b. To be frank that doesn't bode well.
So How Risky Is Yujin TechnologyLtd?
By their very nature companies that are losing money are more risky than those with a long history of profitability. And in the last year Yujin TechnologyLtd had an earnings before interest and tax (EBIT) loss, truth be told. Indeed, in that time it burnt through ₩4.7b of cash and made a loss of ₩6.2b. While this does make the company a bit risky, it's important to remember it has net cash of ₩2.77b. That means it could keep spending at its current rate for more than two years. Overall, its balance sheet doesn't seem overly risky, at the moment, but we're always cautious until we see the positive free cash flow. The balance sheet is clearly the area to focus on when you are analysing debt. But ultimately, every company can contain risks that exist outside of the balance sheet. To that end, you should learn about the 3 warning signs we've spotted with Yujin TechnologyLtd (including 1 which makes us a bit uncomfortable) .
If, after all that, you're more interested in a fast growing company with a rock-solid balance sheet, then check out our list of net cash growth stocks without delay.
New: Manage All Your Stock Portfolios in One Place
We've created the ultimate portfolio companion for stock investors, and it's free.
• Connect an unlimited number of Portfolios and see your total in one currency
• Be alerted to new Warning Signs or Risks via email or mobile
• Track the Fair Value of your stocks
Have feedback on this article? Concerned about the content? Get in touch with us directly. Alternatively, email editorial-team (at) simplywallst.com.
This article by Simply Wall St is general in nature. We provide commentary based on historical data and analyst forecasts only using an unbiased methodology and our articles are not intended to be financial advice. It does not constitute a recommendation to buy or sell any stock, and does not take account of your objectives, or your financial situation. We aim to bring you long-term focused analysis driven by fundamental data. Note that our analysis may not factor in the latest price-sensitive company announcements or qualitative material. Simply Wall St has no position in any stocks mentioned.
About KOSDAQ:A240600
Yujin TechnologyLtd
Yujin Technology Co., Ltd. manufactures and supplies precision molds, processing machine parts, and automation equipment used in secondary battery manufacturing.
Excellent balance sheet with very low risk.
Market Insights

Advertisement
Community Narratives
MINISO's fair value is projected at 26.69 with an anticipated PE ratio shift of 20x
Fair Value US$24.03|11.0% undervalued
BE
Community Contributor
Procter & Gamble: A Dividend Giant Facing Slowing Growth
Fair Value US$119.81|23.3% overvalued
AN
Community Contributor
Eli Lilly's Future Growth Driven by Tirzepatide and Favorable Market Conditions
Fair Value US$1.19k|13.8% undervalued
EA
Community Contributor