
Advertisement
- South Korea
- /
- Machinery
- /
- KOSDAQ:A089140
Shareholders Of NexturnLtd (KOSDAQ:089140) Must Be Happy With Their 119% Total Return
When we invest, we're generally looking for stocks that outperform the market average. And the truth is, you can make significant gains if you buy good quality businesses at the right price. For example, the Nexturn Co.,Ltd. (KOSDAQ:089140) share price is up 93% in the last 5 years, clearly besting the market return of around 54% (ignoring dividends). On the other hand, the more recent gains haven't been so impressive, with shareholders gaining just 21% , including dividends .
See our latest analysis for NexturnLtd
To paraphrase Benjamin Graham: Over the short term the market is a voting machine, but over the long term it's a weighing machine. One flawed but reasonable way to assess how sentiment around a company has changed is to compare the earnings per share (EPS) with the share price.
NexturnLtd's earnings per share are down 14% per year, despite strong share price performance over five years.
This means it's unlikely the market is judging the company based on earnings growth. Since the change in EPS doesn't seem to correlate with the change in share price, it's worth taking a look at other metrics.
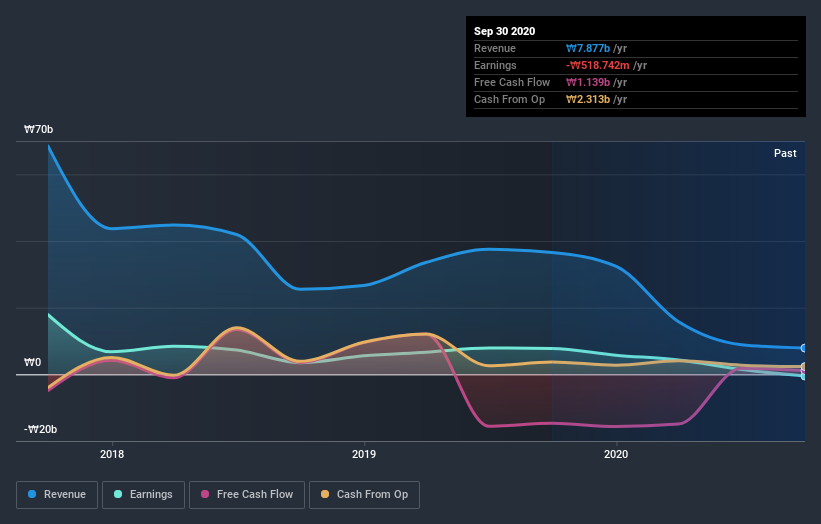
It is not great to see that revenue has dropped by 11% per year over five years. It certainly surprises us that the share price is up, but perhaps a closer examination of the data will yield answers.
You can see below how earnings and revenue have changed over time (discover the exact values by clicking on the image).
Balance sheet strength is crucial. It might be well worthwhile taking a look at our free report on how its financial position has changed over time.
What about the Total Shareholder Return (TSR)?
We've already covered NexturnLtd's share price action, but we should also mention its total shareholder return (TSR). The TSR is a return calculation that accounts for the value of cash dividends (assuming that any dividend received was reinvested) and the calculated value of any discounted capital raisings and spin-offs. Its history of dividend payouts mean that NexturnLtd's TSR of 119% over the last 5 years is better than the share price return.
A Different Perspective
NexturnLtd shareholders are up 21% for the year. But that was short of the market average. On the bright side, that's still a gain, and it's actually better than the average return of 17% over half a decade This could indicate that the company is winning over new investors, as it pursues its strategy. I find it very interesting to look at share price over the long term as a proxy for business performance. But to truly gain insight, we need to consider other information, too. Consider for instance, the ever-present spectre of investment risk. We've identified 2 warning signs with NexturnLtd (at least 1 which is concerning) , and understanding them should be part of your investment process.
If you would prefer to check out another company -- one with potentially superior financials -- then do not miss this free list of companies that have proven they can grow earnings.
Please note, the market returns quoted in this article reflect the market weighted average returns of stocks that currently trade on KR exchanges.
When trading NexturnLtd or any other investment, use the platform considered by many to be the Professional's Gateway to the Worlds Market, Interactive Brokers. You get the lowest-cost* trading on stocks, options, futures, forex, bonds and funds worldwide from a single integrated account. Promoted
Valuation is complex, but we're here to simplify it.
Discover if NEXTURN&ROLLKOREA might be undervalued or overvalued with our detailed analysis, featuring fair value estimates, potential risks, dividends, insider trades, and its financial condition.
Access Free AnalysisThis article by Simply Wall St is general in nature. It does not constitute a recommendation to buy or sell any stock, and does not take account of your objectives, or your financial situation. We aim to bring you long-term focused analysis driven by fundamental data. Note that our analysis may not factor in the latest price-sensitive company announcements or qualitative material. Simply Wall St has no position in any stocks mentioned.
*Interactive Brokers Rated Lowest Cost Broker by StockBrokers.com Annual Online Review 2020
Have feedback on this article? Concerned about the content? Get in touch with us directly. Alternatively, email editorial-team (at) simplywallst.com.
About KOSDAQ:A089140
NEXTURN&ROLLKOREA
NEXTURNBIOSCIENCE Co., Ltd. manufactures and sells CNC automatic lathe machines in South Korea.
Excellent balance sheet and fair value.
Market Insights

Advertisement
Community Narratives
MINISO's fair value is projected at 26.69 with an anticipated PE ratio shift of 20x
Fair Value US$24.03|11.0% undervalued
BE
Community Contributor
Procter & Gamble: A Dividend Giant Facing Slowing Growth
Fair Value US$119.81|23.3% overvalued
AN
Community Contributor
Eli Lilly's Future Growth Driven by Tirzepatide and Favorable Market Conditions
Fair Value US$1.19k|13.8% undervalued
EA
Community Contributor